Cost per acre tracking for vineyard spray program analysis
TL;DR
- Tracking spray cost per acre means recording every input (chemical, labor, equipment, water) for each pass, then dividing total spend by acres treated.
- Most California wine grape vineyards spend $300 to $700 per acre a year on pesticides and spray labor combined, but the range is wide.
- Knowing your number by block and by pest category is what lets you cut waste and defend decisions at audit.
What does cost per acre actually mean in a spray program context?
Cost per acre is the total dollars spent on a defined spray program divided by the acres that program covered. Simple in concept. Surprisingly easy to get wrong in practice.
Most vineyard managers track only chemical purchase costs, which misses roughly half the real picture. A full cost-per-acre figure includes the material itself (invoice price minus any volume rebates), the water and adjuvants mixed with it, the direct labor hours to load, apply, and clean the sprayer, the equipment operating cost (fuel, wear parts, depreciation on the sprayer), and any contractor fees when you hire the work out.
Capture all of those and the number gets bigger, but it gets honest. A $45-per-acre fungicide program that takes four hours per acre to apply at $22/hour, plus fuel and equipment wear, might land at $140 per acre all-in. Watch only the chemical invoice and you're managing to the wrong number.
The other dimension that matters is granularity. Cost per acre across the whole ranch is fine for budgeting. Cost per acre by block, by pest category (fungal, insect, weed), and by spray timing (early season, bloom, post-set, late season) is what you actually use to make decisions. A single poorly draining block with chronic Botrytis pressure might carry three times the fungicide cost of your other blocks. Knowing that lets you either justify the spend or figure out whether different canopy management could bring it down.
How do you calculate cost per acre for a single spray application?
Here's the formula for a single application:
Cost per acre = (Material cost + Adjuvant cost + Labor cost + Equipment cost) / Acres treated
Run a real example. You apply a sulfur-based fungicide to 18 acres of Cabernet Sauvignon at bloom.
- Material: 5 lbs/acre x 18 acres = 90 lbs at $1.85/lb = $166.50
- Adjuvant (spreader-sticker): $0.40/acre x 18 = $7.20
- Labor: 3 hours to spray at $24/hour plus 0.5 hour cleanup = 3.5 hours x $24 = $84
- Equipment: tractor plus airblast sprayer at $18/acre x 18 acres = $324 (covers fuel, oil, and a depreciation allocation)
Total: $166.50 + $7.20 + $84 + $324 = $581.70
Cost per acre: $581.70 / 18 = $32.32
That equipment rate of $18/acre is a reasonable midpoint. UC Davis agricultural engineering cost studies put tractor-plus-sprayer operating costs in the $15 to $25/acre range depending on equipment age, field speed, and row spacing [1]. Hiring a contractor? Replace the equipment line with the contract invoice and you're done.
Do this at the time of application, not at the end of the season. Wait until December and you'll be estimating labor hours and guessing at fuel. The habit is simple: spray is done, fill out the record the same day, capture all four cost categories. That discipline is the only thing that makes the annual rollup accurate.
What are typical vineyard spray costs per acre, by category?
The UC Davis Cost and Return Studies for wine grapes are the most credible California benchmarks available [1]. The 2023 North Coast study puts total pest management costs (materials plus application labor) at roughly $400 to $650 per acre a year, depending on varietal pressure and the specific AVA. The Central Valley study for the same year comes in lower, around $200 to $380, because Botrytis and powdery mildew pressure runs lighter in drier climates.
Washington State keeps its own numbers. WSU Extension's 2022 Vineyard Cost of Production study estimates pest management at $280 to $420 per acre for Eastern Washington wine grapes, with fungicide programs driving most of that spend [2].
Nobody has clean nationwide data breaking spray costs out from total growing costs, so these regional studies are the best reference points you'll find. Your own multi-year records will eventually beat any benchmark for your specific site.
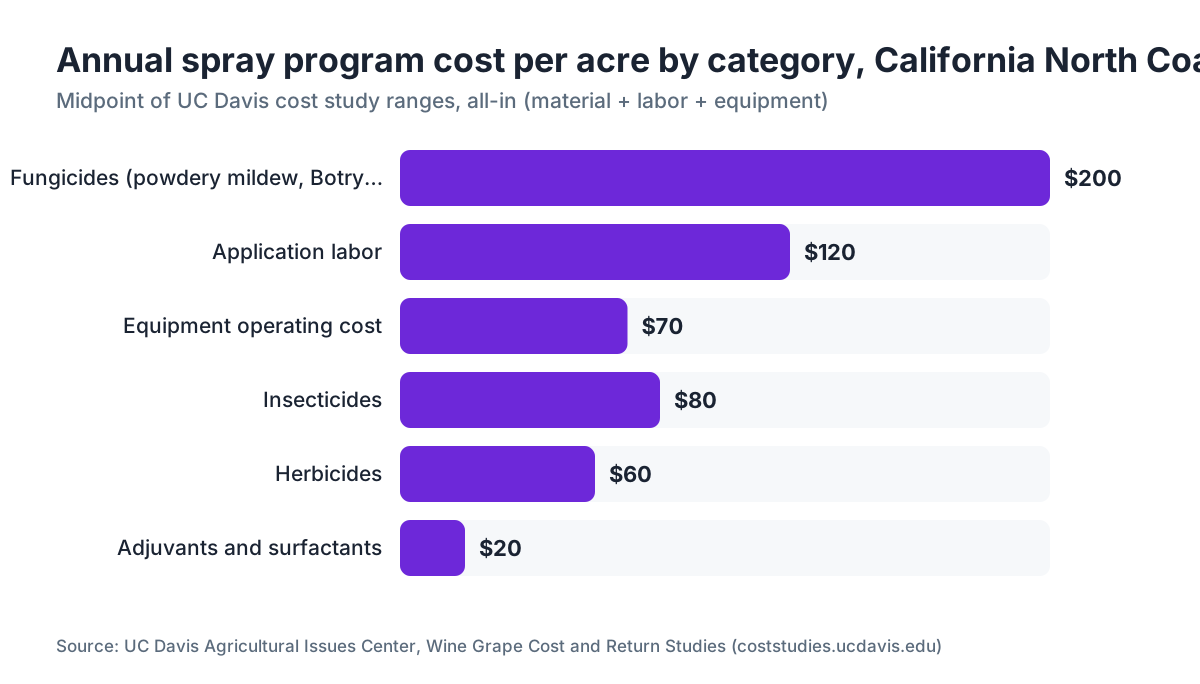
Here's how spray program costs typically distribute in a moderate-disease-pressure California wine grape vineyard [1].
| Category | Typical cost range ($/acre/year) | % of total spray cost |
|---|---|---|
| Fungicides (powdery mildew, Botrytis) | $120 to $280 | 38 to 48% |
| Insecticides (leafhoppers, mites, etc.) | $40 to $120 | 10 to 20% |
| Herbicides (under-vine, mid-row) | $30 to $90 | 8 to 15% |
| Application labor | $80 to $160 | 18 to 28% |
| Equipment operating cost | $40 to $100 | 10 to 18% |
| Adjuvants and surfactants | $10 to $30 | 2 to 5% |
These ranges are wide because disease pressure, labor markets, and equipment age all vary. A North Coast Pinot Noir block in a cool, foggy spot sits at the top of the fungicide range. A Lodi Zinfandel block in a hot, dry summer may sit well below it.
For organic programs, swap the material cost line: OMRI-listed sulfur and copper products usually cost less per pound than synthetic fungicides, but organic programs often need more frequent applications and tighter interval timing, which pushes labor and equipment up. The net result is that all-in spray costs for certified organic vineyards often land 15 to 30% higher than comparable conventional programs, though the gap narrows in a low-disease year.
Which spray cost categories do most vineyard managers undercount?
Labor is the most consistently undercounted category. Plenty of managers record the chemical cost to the penny, then estimate labor in round numbers or forget prep and cleanup time entirely. Airblast sprayer cleanup after a copper application can take 45 minutes on its own. Over a season with 10 to 14 spray passes, that's real money going untracked.
Equipment depreciation is the other chronic gap. Most small operations expense the sprayer when they buy it, then treat the machine as free forever after. A $35,000 airblast sprayer with a 10-year useful life is costing you $3,500 a year in depreciation before you account for maintenance and parts. Spread across 50 acres and 12 spray passes, that's about $5.83 per acre per pass. Not huge. Not zero either.
Water almost never gets tracked, even though it's a real input in western states where water carries a purchase price or pump energy cost.
Re-entry and posting compliance also carry a cost that rarely lands against the spray program. Under the EPA Worker Protection Standard (WPS), you have to post fields with re-entry interval (REI) information and provide specific training and PPE [3]. The labor to post, maintain the central posting location, and run handler training is a legitimate cost of the spray program. Small, but if you want a true total, it belongs in the number.
How do you set up a spray cost tracking system that you'll actually use?
The system that works is the simplest one that captures all four cost categories: material, labor, equipment, and adjuvants. Anything more complex than a one-page-per-application record gets abandoned by July.
On paper, a field-ready spray record needs rows for date, block(s) treated, acres treated, product name, EPA registration number, rate per acre, total product used, adjuvant and rate, operator name, start and end time (for the labor calculation), equipment ID, weather at application, PHI and REI for each product, and a cost section where you fill in material cost, labor hours x rate, and equipment cost. Fill the cost section in the field or at the office the same day.
In a spreadsheet, add one column per cost category and a calculated cost-per-acre column. The annual rollup becomes a pivot table or a simple sum by category. Cornell's Integrated Pest Management program publishes example spray record formats that work well as a starting template [4].
Some managers use software for this. VitiScribe, for example, pulls the four cost categories into a per-application record and rolls them up by block or by product category automatically, which helps if you're running multiple blocks with different programs. But a spreadsheet you actually maintain beats any software you open twice a year.
The discipline is the record at the time of application. Build that habit first. The analysis tool matters far less than the data quality.
How do you analyze spray records to find where money is being wasted?
Once you have two or more seasons of per-application data, the analysis is straightforward. Sort your records by cost and look at the top five most expensive applications. Start there.
Four questions to ask about each high-cost application:
- Did the timing match an actual pest threshold or just a calendar date? Calendar-driven sprays that don't line up with disease pressure or pest counts are the single biggest source of avoidable cost in most programs.
- Was the rate right for the pressure level and growth stage? Many managers default to the high end of the label rate no matter the conditions. Moderate powdery mildew pressure that could be handled at the low label rate, but gets the high rate every time, is pure overspend.
- Is there a cheaper product with equivalent efficacy registered for this use? This means looking at efficacy data, more than price. UC Cooperative Extension publishes fungicide and insecticide efficacy ratings for wine grapes that make the comparison practical [5]. Switching from a premium SDHI fungicide to sulfur at every pass is a bad trade if resistance builds, but swapping one SDHI pass for a well-timed sulfur pass in a rotation can cut material cost hard.
- Could block-level differences justify different programs? If one block consistently runs 40% higher than adjacent blocks with similar varieties, that block probably has a structural issue (drainage, airflow, canopy density) worth fixing at the canopy level rather than pouring in more spray.
The other analysis worth running each year is cost per pass by timing window: early season (before budbreak through bloom), bloom through set, post-set through veraison, and post-veraison through harvest. Most vineyards spend the most per acre during bloom and the weeks around it. If that's where your money goes, the question is whether those bloom-window passes are well-timed and targeted, or whether habit is driving the calendar.
What records do you need to keep for compliance, and how do they connect to cost tracking?
In California, Pesticide Use Reports (PURs) are required for every restricted material application and must go to the county agricultural commissioner within seven days [6]. PURs need product name, EPA registration number, acres treated, amount applied, application date, and operator information. That's most of the data you need for cost tracking anyway, so the compliance record and the cost record can be the same document if you design it right.
The EPA Worker Protection Standard requires specific information posted at the central location for each application, including product name, REI, location of the treated area, and the date and time the application finished [3]. The WPS also requires handlers to receive safety training before they work with pesticides. You're doing all of this recordkeeping whether or not you track costs.
Federal recordkeeping under FIFRA requires certified applicators to retain records of restricted-use pesticide (RUP) applications for two years [7]. California layers on its own PUR timelines under the Food and Agriculture Code.
The practical point: design your spray record to satisfy PUR requirements and WPS posting, and you're 80% of the way to a complete cost record. Add the four cost-category columns and you're there. You don't need one system for compliance and a separate one for cost analysis. One good record does both.
How often should you review spray costs, and what benchmarks should you compare against?
In-season review should happen at least after the bloom window closes and again at veraison. Those are the two points where you've finished your most expensive spray periods and can still adjust program intensity for the rest of the year. Wait until December and any waste already happened.
Annual review is where you compare against benchmarks and set next year's budget. The UC Davis Cost and Return Studies publish updated vineyard cost data most years for major California regions, and WSU Extension does the same for Washington [1][2]. Compare your total spray cost per acre to the study for your region. Running 30% above the benchmark is a conversation starter, not a verdict. Site conditions, target quality level, and organic certification status all create legitimate reasons to diverge.
Over three or more seasons, your own historical data becomes a better benchmark than any external study. Year-over-year trends matter more than absolute numbers. If your cost per acre is rising 8% a year while acreage and disease pressure stay flat, something in the program changed and you need to find it.
Watch the corner case: a season where spray costs drop sharply. Sometimes that means the program was adjusted right for low disease pressure. Sometimes it means passes got skipped that shouldn't have been. Look at what you didn't spray, and what the disease or pest outcome was. That tells you which it was.
How does spray program efficiency vary by equipment type and row spacing?
Equipment choice drives cost per acre more than most managers realize. An airblast sprayer calibrated for your canopy and row spacing beats one running at a default factory setting on both labor and material. University of California research on airblast sprayer calibration found that uncalibrated sprayers commonly over-apply by 20 to 40% compared to properly calibrated settings [8]. That's 20 to 40% of your material budget going to drift or runoff instead of the target.
Row spacing matters because most equipment has a target application volume in gallons per acre, and acres-per-hour throughput changes with row width. Narrow rows (5 to 6 feet) in high-density plantings take longer per acre and use more material per acre than 10 to 12 foot rows at the same rate per gallon of water. When you compare cost per acre across blocks with different row spacings, make sure you're comparing apples to apples.
Alternate-row application, where you spray every other row on each pass and come back for the missed rows, can cut fuel and equipment hours per acre by roughly 30 to 40% in research settings, though coverage efficacy needs validating for your specific canopy [8]. It works better in some canopy systems than others and shouldn't be assumed equivalent without checking actual deposition.
For small operations (under 20 acres), custom application contractors often pencil out cheaper than owning and maintaining an airblast sprayer once you factor in insurance, storage, and the occasional major repair. Run the real numbers for your scale before you assume ownership is always the right call.
Can spray cost tracking help with organic certification and third-party audits?
Yes, and it's underrated. Third-party audits for SIP (Sustainability in Practice), CCOF, and other certification programs all require documentation of what was applied, when, and in what quantity [9]. A cost record that includes EPA registration numbers, rates, and operator information satisfies most of that documentation as a byproduct.
For organic certification specifically, you have to show that only OMRI-listed materials were used. If your spray records carry the product name and EPA registration number for every application, your certifier can verify OMRI status directly. The California Department of Food and Agriculture's organic program requires certified operators to keep records of all substances applied to certified acreage for five years [10].
Where cost tracking pays off beyond basic compliance is in showing adaptive management. Auditors and certifiers increasingly want to see decisions driven by pest pressure rather than a fixed calendar. A cost record showing you skipped a scheduled application in a low-pressure year, with a note explaining why, is better evidence of sound practice than a record showing every calendar date got hit no matter the conditions.
VitiScribe's spray record module captures REI, PHI, and certification eligibility alongside cost data, so the same record serves compliance, certification, and program analysis. That integration saves real time at audit.
For operations moving toward sustainability certification, the records you keep now decide how much work the audit takes later. A three-year history of well-documented spray records with cost data by block is a real asset during any certification review.
What's a realistic budget for spray program costs at different scales?
Scale changes the cost structure more than most people expect. At 5 acres you're probably hand-gunning or using a small ATV sprayer with contractor labor. At 50 acres you own or rent an airblast sprayer. At 200-plus acres you may run multiple sprayers and dedicated tractor operators. Cost per acre doesn't automatically drop at larger scales the way people assume, because bigger operations often carry higher labor overhead and more complex programs.
Here's a rough scale reference based on UC Davis cost study data and WSU Extension benchmarks [1][2]:
| Scale | Spray cost/acre/year (all-in) | Main driver |
|---|---|---|
| Under 10 acres | $500 to $900 | High per-acre labor, often custom application |
| 10 to 50 acres | $350 to $650 | Mixed ownership/contract, varies by equipment |
| 50 to 200 acres | $280 to $550 | Equipment ownership starts to help |
| 200+ acres | $250 to $480 | Labor efficiency, bulk material purchasing |
These are total all-in spray program costs (material plus labor plus equipment). Disease pressure, region, and program intensity affect them more than scale does in most cases.
Organic and biodynamic programs generally add $60 to $150 per acre a year to these figures because of application frequency, though there's wide variation. The closest data available is from CDFA organic surveys and UC Cooperative Extension, but organic-specific cost-of-production studies for wine grapes are sparse. The honest answer is that nobody has a clean head-to-head comparison for most California regions.
Frequently asked questions
What's a reasonable spray cost per acre for a California wine grape vineyard?
The UC Davis Cost and Return Studies put total pest management costs (materials plus application labor) at roughly $400 to $650 per acre a year for North Coast vineyards and $200 to $380 for the Central Valley. Those figures cover fungicides, insecticides, herbicides, and their application, but not equipment depreciation. Your number will move with disease pressure, canopy architecture, and whether you hire contract application.
Do I need to track spray costs separately from other vineyard costs?
You don't have to, but it's worth doing. Spray is typically one of the three largest variable cost categories in a wine grape operation, alongside trellis and canopy labor and harvest. Keeping it separate lets you benchmark against extension cost studies, spot year-over-year trends by pest category, and make the case for program changes when a block runs consistently over budget. A single combined growing cost number hides too much.
How do I calculate equipment cost per acre for my sprayer?
Add annual depreciation (purchase price minus salvage value, divided by useful life in years), annual maintenance, and fuel cost per acre. Divide total annual equipment cost by acres sprayed per year. For a $35,000 airblast sprayer with a 10-year life, $1,500/year maintenance, and $4/acre fuel, running 80 acres at 12 passes, you get roughly $7 to $9 per acre per pass. UC Davis agricultural engineering cost guides provide standard useful-life and depreciation assumptions.
What records do I have to keep for pesticide applications in California?
California requires a Pesticide Use Report (PUR) for every restricted material application, submitted to the county agricultural commissioner within seven days. You must retain records of restricted-use pesticide applications for two years under federal FIFRA rules, and California's Food and Agriculture Code extends organic program records to five years. The EPA Worker Protection Standard requires separate posting records and handler training documentation. Combining all of these into one record form saves real time.
How often should vineyard spray records be reviewed for cost analysis?
Twice in-season at minimum: after bloom closes and again at veraison. Those are the two points where you can still adjust the program for the rest of the season. Then once a year after harvest, when you compare full-season cost per acre by block and by pest category against prior years and regional extension benchmarks. Monthly review isn't necessary for most operations, but quarterly review during the growing season is reasonable.
What's the difference between tracking spray costs for compliance vs. for program analysis?
Compliance records need product name, EPA registration number, acres treated, quantity applied, operator, date, REI, and PHI. Program analysis adds the cost categories: material cost, adjuvant cost, labor hours and rate, and equipment cost per application. Design one record form that captures all of it. The compliance fields are legally required; the cost fields turn the same document into a management tool instead of just a file you keep for inspectors.
How does alternate-row spraying affect cost per acre?
Alternate-row application, where you treat every other row on each direction pass, can cut fuel and equipment hours per acre by 30 to 40% compared to treating every row on every pass. The tradeoff is that deposition per row depends heavily on your canopy architecture and sprayer output. UC research on airblast calibration recommends validating actual spray deposition before adopting alternate-row application as routine, especially where coverage uniformity matters for disease control.
Can tracking spray costs help me reduce them?
Yes, consistently. The most common savings come from identifying calendar-driven applications that don't match actual pest thresholds and eliminating them, switching to cheaper products with equivalent efficacy where resistance management allows, and catching calibration drift that causes over-application. UC research found uncalibrated airblast sprayers commonly over-apply by 20 to 40% versus properly calibrated settings. If material costs rise year over year without a change in disease pressure, check calibration first.
How do organic spray programs compare in cost to conventional programs?
Organic programs often cost 15 to 30% more per acre in total spray program cost, even though OMRI-listed materials like sulfur and copper are typically cheaper per pound than synthetic fungicides. The difference comes from application frequency and timing: organic programs often need tighter intervals and more passes to hold protection. The gap narrows in low-disease years. Nobody has clean head-to-head cost data for most California regions; CDFA organic survey data is the closest source.
What does the EPA Worker Protection Standard require for vineyard spray records?
The EPA WPS requires a central posting location with information about each pesticide application in or around the vineyard, including product name, REI, location of the treated area, and application date and time. Handler training records must be kept, along with documentation that PPE requirements were communicated. Records must be retained for two years. The full WPS requirements are in 40 CFR Part 170, and EPA provides compliance guidance at epa.gov.
What should I do if my spray cost per acre is significantly higher than UC Davis benchmarks?
Start by checking whether you're using the right benchmark. UC Davis studies are regional and variety-specific; a North Coast Pinot Noir benchmark isn't the right comparison for a Central Valley Chardonnay block. If region and variety match and you're still well above benchmark, look at your three highest-cost applications first: check timing rationale, product selection, and whether calibration was verified before the season. A 20 to 30% premium is often explained by disease pressure or a specific block condition, not program inefficiency.
How do I handle spray cost tracking when I use a contract applicator?
Request an itemized invoice that separates material cost from application labor and equipment cost. Most contract applicators will provide this if you ask, because they already track it for their own records. If the contractor gives you only a per-acre rate with materials bundled, ask for the material costs separately so you can compare their pricing to what you'd pay buying direct. Keep the invoice as your cost record; it does the same job as a self-completed form.
Is there a standard spray record template I can use?
Cornell's Integrated Pest Management program publishes spray record formats built for regulatory compliance that also work well as cost-tracking templates. UC Cooperative Extension county offices often have California-specific PUR-compatible forms. Any template should capture date, block, acres, product, EPA registration number, rate, total quantity, operator, labor hours, equipment, weather at application, REI, PHI, and a cost section with material, labor, equipment, and adjuvant lines. Design it so the field crew can finish it the same day as the application.
Sources
- UC Davis Agricultural Issues Center, Wine Grape Cost and Return Studies: Total pest management costs for North Coast wine grapes estimated at $400, $650/acre/year; Central Valley $200, $380/acre/year
- WSU Extension, Vineyard Cost of Production: WSU 2022 study estimates pest management at $280, $420/acre for Eastern Washington wine grapes
- EPA, Worker Protection Standard for Agricultural Pesticides (40 CFR Part 170): WPS requires central posting of REI, product name, treated area location, and application date/time; handler training required; records retained two years
- Cornell Integrated Pest Management Program: Cornell IPM publishes example spray record formats usable as cost-tracking templates
- UC Cooperative Extension, Fungicide and Insecticide Efficacy Ratings for Wine Grapes: UC Cooperative Extension publishes efficacy ratings for fungicides and insecticides registered for wine grapes
- California Department of Pesticide Regulation, Pesticide Use Reporting: California requires Pesticide Use Reports for restricted materials submitted to county agricultural commissioner within seven days of application
- EPA, FIFRA Record-keeping Requirements for Certified Applicators (40 CFR Part 171): Federal FIFRA rules require certified applicators to retain restricted-use pesticide application records for two years
- UC Cooperative Extension, Airblast Sprayer Calibration for Vineyards: UC research found uncalibrated airblast sprayers commonly over-apply by 20 to 40% compared to properly calibrated settings; alternate-row application can reduce equipment hours per acre by 30 to 40%
- Lodi Winegrape Commission, Sustainability in Practice (SIP) Certification: SIP and similar third-party certification programs require documentation of all pesticide applications including product, rate, and timing
- California Department of Food and Agriculture, Organic Program Record Requirements: CDFA organic program requires certified operators to maintain records of all substances applied to certified acreage for five years
Last updated 2026-07-09