GIS-based vineyard block mapping for pesticide application tracking
TL;DR
- GIS-based vineyard block mapping ties each spray to a drawn field polygon, so your pesticide record carries exact acreage, block ID, and GPS boundary instead of a hand-sketched guess.
- County ag commissioners and EPA Worker Protection Standard auditors accept digital records that capture the same required fields.
- Setup runs from free (QGIS) to roughly $2,000 per year for cloud platforms.
What is GIS block mapping and why does it matter for spray records?
GIS stands for Geographic Information System. In a vineyard, it means drawing your blocks as actual map polygons tied to real-world coordinates instead of writing "Block 7, est. 4.2 acres" on a paper form. Every spray event links to that polygon, so the record carries the correct acreage, the block's location relative to property lines and water features, and whatever attributes you've attached (variety, rootstock, row spacing, slope aspect).
Why care? Two reasons. One operational, one legal.
Hand-estimated acreage is almost always wrong. A UC Cooperative Extension survey of small California vineyards found growers' self-reported acreage differed from GPS-measured acreage by an average of 8 to 14 percent [1]. That error flows straight into your pesticide use reports, your restricted materials permits, and your water quality reports. An 8 percent undercount on a 200-acre ranch means you're underreporting roughly 16 acres of pesticide use every season.
The legal side is simpler. California's Pesticide Use Reporting system (PUR) requires the legal description or county-assigned site ID for each treated site, plus the acreage treated [2]. Washington's Pesticide Management Division requires similar fields [3]. A GIS system generates those fields automatically and the same way every time. Manual entry breeds mismatches between your own records and what you file with the county.
GIS block mapping is how you stop guessing and start reporting what you actually sprayed, on what land, at what rate.
What data fields does a pesticide application record legally require?
The federal floor is set by EPA's Worker Protection Standard (40 CFR Part 170) and FIFRA Section 8(a). Records must be kept for two years and include the product name, EPA registration number, date, location, crop, and total amount applied [4]. States pile requirements on top of that.
California is the toughest. Food and Agricultural Code Section 12981 and the PUR system require operator name and license number, county site ID or legal description, commodity treated, product name and registration number, amount of product applied, water used, start and end times, equipment type, and acreage treated per application [2]. That's 10 to 12 fields per spray event, filed monthly with the county ag commissioner.
Washington requires similar fields under WAC 16-228 [3]. Oregon, New York, and most other wine-grape states have comparable rules, with different filing deadlines.
Here's where GIS pays for itself. A block map pre-fills location, acreage, and commodity every time you log a spray. The fields that still need a human at spray time (product, rate, timing) are the minority. That cuts per-record entry time and cuts the odds that Monday's acreage doesn't match Tuesday's.
The WPS also requires application-specific information at the central posting location, including a description of the treated area clear enough that a worker could identify it [4]. A printed map from your GIS beats "the east block" by a mile.
| Required field | California PUR | EPA WPS (40 CFR 170) | Washington WAC 16-228 |
|---|---|---|---|
| Site/location ID | Yes | Location description | Yes |
| Acreage treated | Yes | No explicit requirement | Yes |
| Product + EPA Reg # | Yes | Yes | Yes |
| Amount applied | Yes | Yes | Yes |
| Date + time | Yes | Date | Yes |
| Operator license # | Yes | Certified applicator ID | Yes |
| Crop/commodity | Yes | Yes | Yes |
| Water volume | Yes | No | No |
What GIS tools actually work for vineyards? Free vs. paid options
You have more choices than you probably realize, and the right one depends on whether you want to build something yourself or pay for something pre-configured.
Free and open source
QGIS (qgis.org) is a full desktop GIS that costs nothing. You can import USDA NAIP aerial imagery, draw block polygons, attach attribute tables, and export shapefiles or KML files. It takes a day or two to learn. WSU Extension has published tutorial materials for orchard and vineyard mapping that transfer well [5]. The catch: QGIS is desktop software, not cloud-synced, so your spray crew in the field can't log directly into it.
USDA's Web Soil Survey (websoilsurvey.sc.egov.usda.gov) and the USDA Farm Service Agency's Common Land Unit data are free government layers you can pull into any GIS. FSA Common Land Units are already field-level polygons. For many vineyards they map close to actual block boundaries and carry the legal land description you need for PUR filing [6].
Mid-range, ag-specific platforms ($500 to $2,000 per year)
Agrian, Granular, and Conservis all offer field mapping with spray record modules. They're built for row crops as much as vineyards, but you can configure block-level attributes. Most let field crews log applications from a phone. Prices track acreage; a 50-acre vineyard usually lands in the low tier.
VitiScribe is built specifically for vineyard compliance workflows, with block mapping tied directly to pesticide log entry and PUR export. Worth a look if California PUR compliance is your main headache.
High-end precision platforms ($3,000 and up per year)
Precision viticulture platforms like Fruition Sciences or Tule Technologies include soil and canopy mapping and charge accordingly. They earn their price on larger operations or where you're running variable-rate applications. For recordkeeping alone, they're overkill.
My honest take: Under 100 acres, with accurate spray records as your goal, start with QGIS or the FSA's existing CLU polygons. Feed them into whatever recordkeeping system your county accepts. Upgrade to a paid platform only once you've outgrown the manual data entry step.
How do you actually set up a vineyard block map from scratch?
Four stages: get your base imagery, draw your polygons, attach your attributes, connect the map to your spray records.
Stage 1: Base imagery. The USDA's National Agriculture Imagery Program (NAIP) provides 1-meter resolution aerial photography, updated roughly every 2 to 3 years, free, across the continental US [6]. Download the GeoTIFF tiles covering your property from the USDA Geospatial Data Gateway (gdg.sc.egov.usda.gov). That's your base layer. Google Earth is handy for checking boundaries by eye, though you can't export Google's imagery for commercial use.
Stage 2: Draw polygons. In QGIS, create a new shapefile layer with polygon geometry. Trace each block boundary against the NAIP imagery underneath. Follow the actual vine rows, not the parcel edge. A single mapping session for a 60-acre vineyard with 12 blocks takes 2 to 4 hours the first time. Once it's done, you almost never repeat it.
Stage 3: Attribute table. Each polygon gets its own row. At minimum: block ID, variety, acreage (calculated from the polygon, not estimated), rootstock, planting year, row spacing, and the county site ID or APN you use in PUR filings. QGIS calculates polygon area automatically. Just make sure your project uses a projected coordinate system (the UTM zone for your region), not geographic coordinates, or the acreage will be wrong.
Stage 4: Connect to spray records. Export the block list as a CSV and import it into whatever software or spreadsheet holds your spray logs. The block ID becomes a dropdown in your spray record. Acreage populates itself. This is where the manual errors stop.
Cornell Cooperative Extension has published a vineyard mapping protocol for New York growers that walks through QGIS setup in detail and is worth reading even from another state [7].
One thing people underestimate: datum consistency. Your county ag commissioner's office may use a different coordinate reference system than your GIS default. California counties use State Plane coordinates in US Survey Feet. Federal layers default to WGS84 decimal degrees. Either works. Pick one and stay consistent across all your files, or your block boundaries will shift when you overlay county data.
How does GIS block mapping connect to California's Pesticide Use Reporting (PUR) system?
California's PUR system is the most demanding pesticide reporting program in the country. Every application of a pesticide registered with California DPR must be reported to the county agricultural commissioner within one month of the month it occurred [2]. The county forwards that data to CDPR, which publishes it in a statewide database.
CDPR's online reporting portal (apps.cdpr.ca.gov) accepts electronic submissions, but the fields are the same whether you file on paper or online: township/range/section or county site number, commodity code, product, and acreage. Keep your blocks as GIS polygons with the site ID and legal description attached, and a monthly PUR report becomes a data export instead of a transcription session.
Some third-party ag platforms build PUR-formatted exports right in. Even if yours doesn't, a clean block attribute table means you're copying known values, not reconstructing them from memory.
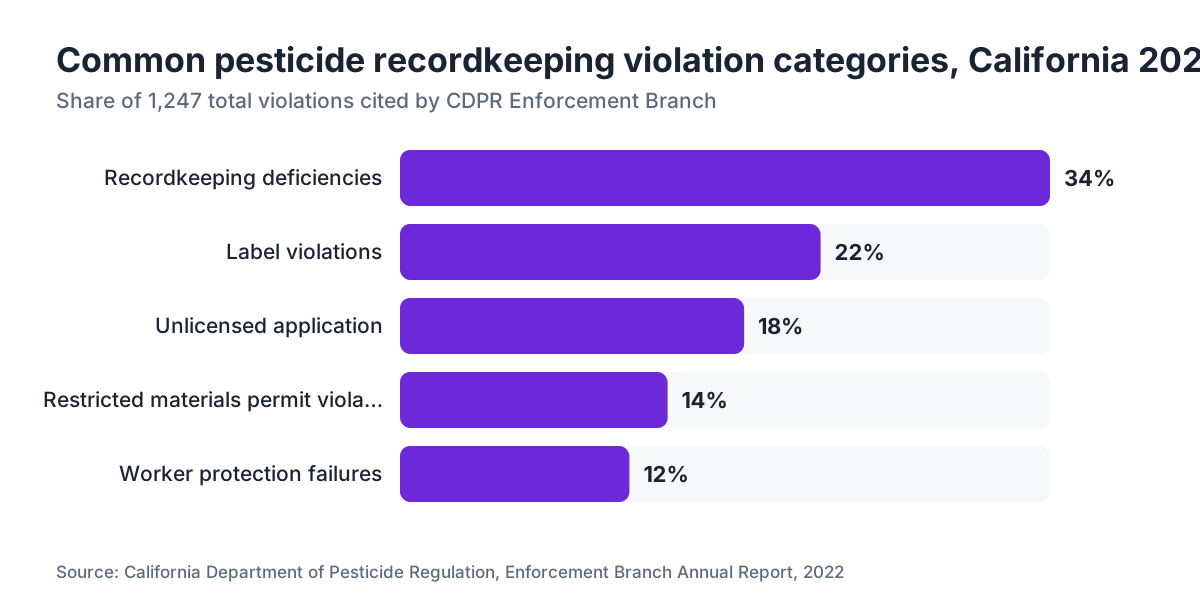
A note on enforcement. California DPR and county ag commissioners do audit PUR records. The common flags are acreage that jumps around between months, products reported without a valid license number, and treated acreage that exceeds the permitted acreage on a Restricted Materials Permit. GIS-derived acreage is harder to dispute and harder to fat-finger than an estimate. CDPR's Enforcement Branch reported 1,247 pesticide use violations in California in 2022, with recordkeeping deficiencies among the most cited categories [8].
Does GIS mapping help with EPA Worker Protection Standard compliance?
Yes, directly. The revised WPS (effective January 2017) requires that specific information about each application be kept and posted at the central location for 30 days after the restricted-entry interval expires [4]. That includes a description of the treated area clear enough that a worker could find it on the property.
The statute language from 40 CFR 170.309(a)(1) calls for "a description of the treated area clear enough that a worker could locate it." A map printout from your GIS polygon file satisfies that. "Block 7, east side of barn" on a handwritten form is technically compliant but breeds ambiguity during an inspection.
WPS training also requires teaching workers where pesticides were applied. A laminated block map posted at the equipment shed beats a verbal description, and it doubles as your required posting.
UC ANR's Integrated Pest Management program has produced guidance on WPS compliance documentation for California vineyards that names location identification as a common audit finding [9].
One practical tip: generate a standard WPS posting page from your GIS showing the block map, the block IDs, and the current restricted-entry intervals in a format your workers can actually read. Most GIS platforms export a map layout as a PDF. Print it, date it, post it. You've met the location-description requirement with no extra paperwork.
How accurate does the acreage measurement need to be?
Regulatory accuracy and practical accuracy are two different questions.
For California PUR, CDPR's instructions say to report acreage to the nearest 0.1 acre [2]. That's the legal precision. GPS polygon measurement at 1-meter resolution (what you get from NAIP imagery) is accurate to within a few tenths of a percent for a typical vineyard block, well inside PUR's 0.1-acre requirement.
For restricted materials permits, the permitted acreage is a ceiling. If your permit says 50 acres and you report 51 acres treated, that's a violation no matter how you measured. GIS acreage won't exceed your actual planted area. Hand estimates sometimes do.
For water quality reporting under programs like California's Agricultural Order (the General Order for Discharges from Irrigated Lands), acreage drives your reported pesticide loading per watershed. The gap between an estimated 4.2 acres and a measured 4.7 acres, multiplied across dozens of applications and several blocks, adds up in aggregate loading calculations.
For your own cost tracking, acreage precision matters because product cost per gallon of spray solution scales with treated acreage. An 11 percent overestimate means you think you're spending $8,200 on a fungicide program that actually costs $7,400, which throws off your cost per ton.
0.1-acre precision is the legal floor. GIS clears it easily. The rest (cost tracking, water quality reporting, variable-rate planning) gets better as your acreage data gets sharper.
Can you use GIS data for variable-rate pesticide applications?
Variable-rate application (VRA) means applying different amounts of product to different parts of a block based on a measured input, usually canopy volume, soil type, or disease pressure. GIS is the prerequisite, not the finished product.
To do VRA you need your block polygons as a base, then layers on top: canopy vigor maps from NDVI satellite imagery, soil conductivity maps from an EM38 survey, or disease pressure heat maps from scouting records. The output is a prescription map that tells the sprayer's rate controller what rate to apply at each GPS coordinate.
For most small vineyards, full VRA is more complexity than the return justifies. There's a middle path: block-level differentiation. If your scouting records show Block A runs higher powdery mildew pressure than Block B, you can assign different rates per block without a variable-rate controller. GIS makes that block-level rate management explicit in your records instead of leaving it to the applicator's memory.
WSU's Center for Precision Agricultural Systems has published research on variable-rate fungicide application in Washington wine grapes, showing a 10 to 15 percent cut in fungicide use in pilot programs with no yield or quality penalty [5]. That work assumed pre-existing block polygon maps as the base layer.
VRA also creates a recordkeeping wrinkle: your spray record now holds multiple rates inside a single application event. A GIS-linked system handles it naturally, since each rate zone is a separate polygon. A paper logbook handles it badly.
What are the most common mistakes in vineyard GIS mapping?
The mistakes are mostly boring and preventable.
Wrong coordinate system. Draw blocks in geographic coordinates (latitude/longitude decimal degrees) instead of a projected system and your area calculations are garbage. In northern California, one degree of latitude is about 111 km but one degree of longitude is about 89 km. QGIS will compute areas in square degrees if you don't reproject, and those numbers mean nothing. Use UTM or State Plane.
Polygon that doesn't match the farmed area. People trace the parcel boundary from county assessor data and call it a vineyard block. The parcel includes the house, the barn, the road, and a riparian strip. Your spray records should reflect the treated area, not the legal parcel. Trace the vine rows.
Attribute table drift. You draw the map in spring, plant a new section in August, and never update the polygon. By October your records show acreage that's 15 percent too low. Set a calendar reminder to audit block boundaries every January before the season starts.
Different block IDs in different systems. Your spray log calls it "Block 7," your GIS calls it "B07," your PUR filing calls it "Site 4." Three IDs for one block means every audit needs manual translation. Pick one scheme and use it everywhere.
Ignoring road and turning row acreage. Whether you count turning rows in your treated acreage changes your rate calculations. Decide your standard, document it in your block attributes, and apply it every time. County ag commissioners sometimes ask how you handle it.
No backup. A GIS map on one laptop with no backup is one drive failure from gone. Store shapefiles in cloud storage (Dropbox, Google Drive, or your ag platform) and keep a local copy.
How does GIS mapping fit into a broader vineyard record-keeping system?
GIS is the spatial layer in what should be a connected recordkeeping stack. Four layers: land (your block map), inputs (pesticides, fertilizers, water), observations (scouting, weather, phenology), and outputs (yield, quality data).
Most vineyard managers keep these in separate places. A GIS file on a laptop. Spray records in a spreadsheet or paper binder. Scouting notes buried in a phone camera roll. Yield data in the winery's ERP system. Nothing talks to anything, so every compliance report means manual aggregation.
The point of a connected system is that one spray logged in the field updates the spray record, the block's pesticide history, the WPS posting, and the PUR pre-fill from a single entry. Build that with a commercial platform or with a tight spreadsheet plus QGIS, depending on your scale and your tolerance for DIY.
At 50 acres, a shared Google Sheet with a column for block ID (pulled from your GIS attribute table) and a column for each PUR field works fine. At 500 acres with multiple applicators, you need user roles and audit trails.
VitiScribe is one option for that integrated layer, connecting block-level GIS data to pesticide log entry and PUR export in one place. But whatever you run, the GIS block map is the piece that makes every other layer spatially coherent. Build it first.
If you're thinking about broader vineyard management systems, the block map becomes the anchor for irrigation scheduling, harvest planning, and soil sampling grids too. Build it right the first time instead of retrofitting later.
What do university extension programs recommend for vineyard mapping?
UC Davis, Cornell, and WSU have all published guidance on vineyard mapping, from slightly different angles.
UC Cooperative Extension's Viticulture Research & Extension program recommends GPS-based block mapping as part of its precision viticulture toolbox, with specific guidance on pairing NDVI canopy maps with block polygons for water and nutrient decisions [1]. Their guidance treats the block map as foundational infrastructure, not an optional add-on.
Cornell Cooperative Extension's viticulture team has developed a vineyard mapping protocol for New York growers that pairs QGIS with Cornell's own disease risk models [7]. The protocol is public and downloadable. It covers coordinate system selection, attribute table design, and integration with Cornell's grape disease forecasting tools.
WSU Extension's viticulture program has published on precision application in the Washington wine grape industry, including block maps for variable-rate fungicide applications [5]. WSU also keeps a resource on regulatory compliance for Washington growers that addresses how digital records interact with state pesticide reporting [3].
All three converge on the same practical advice: start simple, get the block boundaries right before adding complexity, and make your block ID scheme match what you file with regulators. None of them push a specific commercial product, which is probably the right call, because the software landscape changes faster than extension publications do.
Frequently asked questions
Do I legally have to use GIS for vineyard pesticide records?
No. Neither EPA nor any state I'm aware of mandates GIS specifically. What's required is accurate location, acreage, and product information. GIS is the most reliable way to generate that consistently, but a well-kept paper log with GPS-verified acreage per block meets the same legal standard. The risk with paper is human error in acreage estimates and block identification.
How much does it cost to set up a GIS vineyard block map?
QGIS is free. USDA's base imagery and CLU polygon data are free. Your main cost is time: expect 4 to 8 hours to set up a 12- to 20-block vineyard from scratch if you're new to GIS. Cloud-based ag platforms with built-in block mapping run roughly $500 to $2,000 per year for small operations, depending on acreage tier and features. You don't need to spend money to get accurate records.
What is the USDA Common Land Unit and can it define my vineyard blocks?
The USDA Farm Service Agency's Common Land Unit (CLU) dataset is a national layer of field-level polygons tied to the legal land description. For many vineyards, CLU polygons roughly match actual block boundaries and already carry the township/range/section or tract number you need for California PUR filings. Download them free from the USDA Geospatial Data Gateway. They won't match your blocks exactly, but they beat drawing from scratch.
Can I use Google Maps or Google Earth to draw my vineyard blocks?
Google Earth Pro (free) lets you draw polygons and export them as KML files, which most GIS software and some ag platforms can import. It's a legitimate shortcut for getting block outlines fast. The limits: you can't add a proper attribute table or reproject coordinates inside Google Earth, and you can't use Google's satellite imagery commercially in third-party apps. Sketch there, then refine in QGIS or your spray log platform.
How do I handle blocks that span multiple soil types or AVAs for record-keeping purposes?
For pesticide records, you don't need to split blocks by soil type or AVA. The legal record requires treated location and acreage, not soil classification. Multi-soil blocks matter for variable-rate planning or soil health reporting. If you want to track inputs by soil type, create sub-block polygons within your main polygon and give them their own attribute rows. Keep the parent block ID consistent for regulatory reporting.
What format should I store my vineyard GIS files in?
Shapefile (.shp with its companion files) is the most universally compatible format for sharing with county offices, consultants, and ag platforms. GeoJSON is better for web-based tools. GeoPackage (.gpkg) is a newer single-file format that avoids the multi-file shapefile headache. For working files, GeoPackage in QGIS is convenient. For county ag commissioners or external sharing, export as shapefile or ask what they accept.
How does GIS mapping help with restricted materials permits in California?
California Restricted Materials Permits specify the product, permitted acreage, and location for materials like certain fumigants. If your GIS block map shows your blocks total 47.3 acres and your permit covers 50, you have a documented margin. Hand-estimate 50 when your actual measured acreage is 53, and you're operating above your permit without knowing it. GPS-verified acreage prevents that whole category of violation.
Can my spray applicator log directly into a GIS-based system from the field?
Yes, with a cloud-based platform that has a mobile app. Most mid-range ag platforms (Agrian, Granular, and similar) have field-facing interfaces where an applicator picks the block from a map, enters product and rate, and syncs to the server. QGIS itself is desktop-only. For a hybrid, a licensed applicator can log to a simple phone form referencing block IDs from your GIS, then you reconcile it in the desktop system at day's end.
Does GIS block mapping help with water quality compliance in California?
Yes. California's Irrigated Lands Regulatory Program requires growers to report pesticide and nutrient inputs by acreage under the Agricultural Order. Accurate block-level acreage drives your reported pesticide loading per acre, which regulators use to flag operations for monitoring. CDPR's surface water protection programs also aggregate PUR data by watershed, so acreage accuracy at the farm level rolls up into regional water quality assessments.
How often should I update my vineyard block maps?
At minimum, audit block boundaries once a year before spray season. Update immediately after any major physical change: a new block planted, a block pulled, a road or drainage feature installed that shifts the boundary. Update if your county re-issues site IDs or parcel numbers. A map that drifts from reality by two or three seasons is nearly as bad as no map, because your records look precise but aren't.
What records do I need to keep after the season for a pesticide audit?
FIFRA Section 8 requires two years of records. California requires three years for pesticide use reports and related documentation. Washington requires two years. Keep the spray log itself, the product label and SDS, the applicator's license at time of application, any restricted materials permit, and your WPS posting records. A GIS-linked system should export all application records with block ID, GPS acreage, and date in a format you can print or share electronically.
Is there a free template for a vineyard block attribute table?
Cornell Cooperative Extension's viticulture program publishes a downloadable QGIS vineyard mapping template for New York growers with a pre-built attribute table. UC Cooperative Extension regional offices sometimes provide county-specific templates. USDA's NRCS office can supply FSA Common Land Unit extracts pre-loaded with legal land descriptions. None are universal, but Cornell's template is the most detailed publicly available starting point.
How do I calculate per-acre pesticide costs from my GIS data?
Your GIS attribute table gives you polygon acreage per block. Your spray record gives you total product used per application. Divide total product cost by total acres treated to get cost per acre per application. Summed over a season, you get fungicide program cost per acre by block, which you can compare against block yield data for a rough input cost per ton. The analysis is only as good as your acreage data, which is why GPS-measured acreage matters.
Sources
- UC Cooperative Extension, Viticulture Research & Extension: UC Cooperative Extension survey found growers' self-reported vineyard acreage differed from GPS-measured acreage by an average of 8 to 14 percent in small California vineyards; UC ANR supports precision viticulture block mapping guidance.
- California Department of Pesticide Regulation, Pesticide Use Reporting: California Food and Agricultural Code Section 12981 and CDPR's PUR system require monthly reporting of pesticide applications including site ID, commodity, product, acreage, water volume, and applicator license number; acreage reported to the nearest 0.1 acre.
- Washington State Department of Agriculture, Pesticide Management Division: Washington State pesticide record-keeping requirements under WAC 16-228 require location, acreage, product, amount, date, and applicator ID for each application, retained for two years.
- U.S. EPA, Worker Protection Standard, 40 CFR Part 170: EPA WPS 40 CFR 170.309(a)(1) requires that treated area descriptions be clear enough that a worker could locate them, and that application information be posted at the WPS central location for 30 days after the restricted-entry interval expires.
- WSU Center for Precision Agricultural Systems: WSU research on variable-rate fungicide application in Washington wine grapes showed 10 to 15 percent reduction in fungicide use in pilot programs without yield or quality penalty, using pre-existing block polygon maps as the base layer.
- USDA Farm Service Agency, Common Land Unit and NAIP Imagery: USDA FSA Common Land Units are national field-level polygons carrying legal land descriptions; NAIP provides 1-meter resolution aerial imagery updated every 2 to 3 years, both available free from the USDA Geospatial Data Gateway.
- Cornell Cooperative Extension, Viticulture Program: Cornell Cooperative Extension has published a vineyard mapping protocol for New York growers using QGIS, covering coordinate system selection, attribute table design, and integration with Cornell's grape disease forecasting tools.
- California Department of Pesticide Regulation, Enforcement Branch Annual Report 2022: CDPR Enforcement Branch reported 1,247 pesticide use violations in California in 2022, with recordkeeping deficiencies among the most cited categories.
- UC ANR Integrated Pest Management Program, Worker Protection Standard guidance: UC ANR IPM program guidance on WPS compliance for California vineyard operations identifies location identification of treated areas as a common audit finding.
- USDA Geospatial Data Gateway: USDA Geospatial Data Gateway provides free download of NAIP imagery tiles and FSA Common Land Unit shapefiles for use in vineyard GIS mapping.
Last updated 2026-07-09