Calculating nitrogen credits from cover crop incorporation in vineyards
TL;DR
- Cover crops release 20 to 60% of their nitrogen to the next crop after incorporation, driven by tissue N concentration, C:N ratio, and soil conditions.
- A legume stand with 3 to 4% N in dry tissue can hold 90 to 315 lbs N/acre, but only a slice becomes plant-available that season.
- Calculate the credit by multiplying dry biomass by tissue N% by a mineralization efficiency factor, then discount for how well release timing matches vine demand.
Why does nitrogen crediting from cover crops matter in a vineyard?
Vineyards face fertilizer scrutiny from neighbors, regulators, and water-quality programs. Over-apply nitrogen and you push vines into excess vigor, thin out color, and risk groundwater contamination. Under-apply and you starve a crop that can't tell you it's hungry until harvest quality has already slipped. Cover crop incorporation sits between those two mistakes: a real nitrogen source you're already paying to grow, and one most vineyard managers either leave off the nutrient plan entirely or wildly overestimate.
Getting the credit right is a compliance issue in several regions. California's Irrigated Lands Regulatory Program requires growers to account for all nitrogen inputs, including organic amendments, when they calculate a farm nitrogen budget [1]. If your cover crop is releasing nitrogen and you're not counting it, your nitrogen use efficiency numbers look worse than they are, and you may pile synthetic fertilizer on top of an organic flush you never saw coming.
The math isn't hard. It takes a few field measurements and some honest assumptions about soil biology. A good-faith estimate beats a blank line on the nutrient plan every time, and this article walks through every step of getting one.
What nitrogen credit can a vineyard cover crop realistically provide?
Anywhere from near-zero to about 200 lbs N/acre of plant-available nitrogen over a season. Where you land depends on species mix, stand density, biomass, tissue nitrogen concentration, and how alive your soil is. Those numbers come from the range of legume and grass tissue N values documented in UC Cooperative Extension research on cover crops in California vineyards [2].
Here's a rough framework before the detailed math.
| Cover crop type | Typical tissue N (dry wt) | Typical dry biomass (tons/acre) | Estimated total N (lbs/acre) | Season-1 availability |
|---|---|---|---|---|
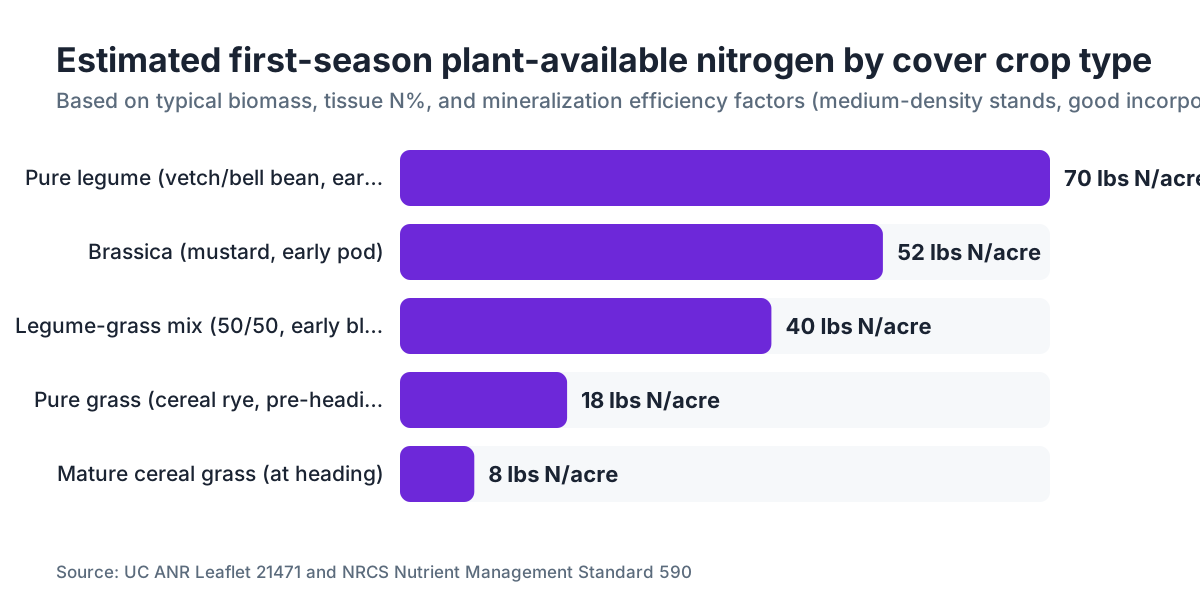
| Pure legume (e.g., bell bean, vetch) | 3.0 to 4.5% | 1.5 to 3.5 | 90 to 315 | 30 to 60% |
| Legume-grass mix (50/50) | 2.0 to 3.2% | 1.5 to 3.0 | 60 to 192 | 20 to 40% |
| Pure grass (e.g., cereal rye, barley) | 1.0 to 2.0% | 1.5 to 3.5 | 30 to 140 | 10 to 20% |
| Brassica (e.g., mustard, daikon) | 2.5 to 4.0% | 1.0 to 2.5 | 50 to 200 | 30 to 50% |
Season-1 availability is the fraction that actually mineralizes and reaches the vine during the growing season after incorporation. Grasses and high-residue crops carry wide C:N ratios, often above 25:1, which slows mineralization and can lock up soil nitrogen instead of releasing it. Pure legumes usually run 10:1 to 20:1, so they break down fast [3].
Mow a cereal rye stand and till it in at bloom, and you won't offset much synthetic fertilizer that year. Mow a mature vetch stand at 50% bloom, work it into warm soil in late March or early April in a California coastal valley, and you can realistically bank 40 to 80 lbs of plant-available N per acre by bloom.
How do you measure cover crop biomass accurately enough to use in a calculation?
You don't need a lab scale in the vineyard. You need a 0.25 m² quadrat (cut from PVC pipe or wire), a luggage scale or postal scale, and a way to dry samples.
Step 1: Cut and weigh fresh biomass. Throw your quadrat down in five to ten representative spots across the block, avoiding headlands. Clip everything at the soil surface, bag it, and weigh fresh. Average the weights.
Step 2: Convert to dry weight. Fresh biomass is mostly water, often 75 to 85% by weight in legumes near peak bloom. Dry a subsample at 140°F (60°C) for 48 to 72 hours in a kitchen oven or an inexpensive food dehydrator, then calculate the dry-matter percentage. If fresh weight averages 1.2 lbs per 0.25 m² and dry weight is 0.22 lbs, your dry-matter fraction is 18%.
Step 3: Scale to acres. One acre contains 4,047 square meters, or 16,188 quarter-meter quadrats. So: 0.22 lbs dry × 16,188 = 3,561 lbs dry biomass per acre, which is about 1.78 tons per acre. That's a realistic medium-density legume stand.
Step 4: Get tissue N. Either send a dried subsample to a certified lab (cost typically runs $15 to 25 per sample through most UC Cooperative Extension-affiliated labs) or use published species averages as a starting point. Published averages are fine for planning; lab analysis is better if you're trying to meet a regulatory nitrogen budget. UC ANR Leaflet 21471 gives species-specific values for many California cover crops [2].
Any vineyard manager who's done this once will tell you the biomass swing across a block surprises them. Wet spots, dry ridges, shade from trellises, and traffic compaction can move stand density by 50% inside the same block. Five sampling points is a minimum. Ten is better.
What is the step-by-step formula for calculating the nitrogen credit?
Once you have dry biomass and tissue N concentration, the core calculation is four steps.
Step 1: Total N in biomass
Dry biomass (lbs/acre) × tissue N fraction = total N in biomass
Example: 3,561 lbs/acre × 0.034 (3.4% N) = 121 lbs total N/acre
Step 2: Apply a mineralization efficiency factor (MEF)
The MEF is the fraction of that total N that becomes plant-available during the current growing season. Use the residue's C:N ratio to pick your MEF:
| C:N ratio of residue | Recommended MEF (season 1) |
|---|---|
| < 15:1 (legume at early bloom) | 0.50 to 0.60 |
| 15:1 to 25:1 (legume-grass mix) | 0.30 to 0.45 |
| 25:1 to 40:1 (mature grass) | 0.10 to 0.25 |
| > 40:1 (straw, mature cereal) | 0.05 to 0.15 |
These ranges match values used by UC Cooperative Extension nutrient management guidelines and by the USDA Natural Resources Conservation Service [3][4].
Example continued: 121 lbs N × 0.50 MEF = 60.5 lbs plant-available N/acre
Step 3: Apply a timing synchrony discount
Vines pull most of their nitrogen between bud break and bloom, roughly March through May in California's North Coast. Incorporate the cover crop at least 4 to 6 weeks before that window and the release lines up well with vine demand. Incorporate late and much of the N flushes before vine roots are active enough to grab it, or it leaches with spring rains. Late incorporation, after bloom, can cut effective capture to 30 to 50% of your calculated credit [2].
Example: good timing keeps 60.5 lbs. Late timing means multiply by 0.6: 60.5 × 0.6 = 36 lbs effective N/acre.
Step 4: Subtract from synthetic fertilizer need
If your tissue-tested vines need 40 lbs N/acre and your cover crop credit is 36 to 60 lbs, you may need zero synthetic nitrogen that year, maybe less if last year's organic matter is still releasing. Confirm the assumption with petiole sampling at bloom [5], year over year, so you're not flying blind.
How does the C:N ratio of cover crop residue affect nitrogen release timing?
The C:N ratio is the central variable, and it's the one vineyard managers skip most often on back-of-the-envelope estimates.
Soil microbes decomposing plant residue need about 24 parts carbon for every 1 part nitrogen to build their own bodies. When residue has a C:N ratio above roughly 25:1, the microbes pull nitrogen out of the surrounding soil to make up the shortfall. That immobilizes soil N temporarily, which means the cover crop is competing with your vines for nitrogen in the short term. This is not hypothetical. Field trials on grass cover crops in California vineyards recorded vine N status dropping in the weeks right after incorporation of mature cereal cover crops [3].
Legumes at early to mid-bloom typically run 10:1 to 20:1. Cereal rye at heading runs 40:1 to 80:1. Mature mustard residue, after seed set, climbs above 30:1. Vetch-cereal mixes land somewhere between, depending on the ratio at mow time.
Practical version: if you're growing a cereal cover crop for erosion control and you want nitrogen credit too, mow it early, well before heading, while the tissue is still green and the C:N ratio sits in the 20:1 to 25:1 range. You give up some biomass by not waiting, but you gain mineralization speed. The WSU Extension cover crop guidance for the Pacific Northwest also recommends mowing before seed set to raise N contribution and cut weed seed bank issues [6].
You can get a rough C:N estimate from tissue N alone. Carbon in dry plant tissue is nearly always 40 to 45% by weight. So if tissue N is 3%, C:N is roughly 42/3 = 14:1. If tissue N is 1.5%, C:N is roughly 43/1.5 = 29:1. Close enough for a credit calculation.
Does cover crop nitrogen credit count toward California's nitrogen management requirements?
Yes. California's Irrigated Lands Regulatory Program, run by the State Water Resources Control Board, requires growers in most regions to track all nitrogen inputs and calculate a nitrogen use efficiency for the operation [1]. Cover crop nitrogen released to the soil is an input, and you're expected to include it.
The method isn't strictly prescribed, which gives you room to work, but you have to document your approach. A paper trail with biomass samples, tissue N lab results, and the MEF you used holds up in an audit. Guessing does not.
Most vineyard nutrient management plans built with a certified crop adviser (CCA) use the formula structure described in this article, sourced from UC ANR guidelines. If you're in a Nitrogen Management Plan area, meaning most of the Central Valley plus parts of the North Coast and Central Coast, your CCA is required to have training in this method [1].
Outside California, check your state's nutrient management program. Oregon's Department of Agriculture and Washington's Department of Ecology both run voluntary nutrient management planning tools that accept organic N credits with similar methodology. Cornell Cooperative Extension's nutrient guidelines for New York wine grapes walk through a comparable approach for eastern viticulture [5].
If you're trying to track these numbers season over season without building a spreadsheet empire, a platform like VitiScribe can log biomass samples, tissue results, and calculated credits in the same system as your spray logs and soil tests. That matters when someone asks you to show your work during a regulatory review.
What species of cover crop contribute the most nitrogen in a vineyard row middle?
Legumes own the high end. Bell beans (Vicia faba var. equina), woolly pod vetch (Vicia villosa ssp. dasycarpa), and common vetch (Vicia sativa) are the workhorses of California wine country. They establish reliably in the October-November planting window, tolerate the cool wet period, and fix enough nitrogen through Rhizobium nodulation to contribute credits that show up in a budget.
UC Cooperative Extension trials in the North Coast and Central Coast found a good bell bean or vetch stand fixes 100 to 200 lbs N/acre from atmospheric nitrogen, with roughly 50 to 70% of that available to a following crop after incorporation [2]. The catch: fixation only happens when soil rhizobia populations are adequate, so inoculate your seed if you haven't grown legumes in that block before.
Brassicas, mostly mustard and daikon radish, carry high tissue N (2.5 to 4%) and break down fast thanks to a low C:N ratio, but they fix no atmospheric nitrogen. They scavenge residual soil N and cycle it back. That still cuts leaching, but it adds no new N to the system.
Grasses, meaning cereal rye, barley, oats, and annual ryegrass, are better at erosion control and organic matter building than nitrogen supply. If nitrogen credit is your main goal, don't lean on grasses.
Austrian winter peas work well in the Pacific Northwest and higher-elevation Sierra Foothills sites. Cornell Extension recommends crimson clover or hairy vetch for most New York vineyard interrows, with tissue N in the 3 to 4% range at incorporation [5].
When should you incorporate a cover crop to maximize the nitrogen credit to vines?
Timing is the most consequential variable after species selection. Miss the window by four to six weeks and you can halve your effective nitrogen credit.
The goal is to incorporate when two things line up: the cover crop is at peak N concentration (early to mid-bloom for most legumes), and soil temperatures are warm enough for active microbial decomposition, ideally above 50°F and climbing. In California's North Coast, that window often falls in late March through mid-April. In Washington's Yakima Valley, it's closer to late April through May. In New York's Finger Lakes, late April into May [5][6].
Incorporate too early, in December or January in California, and you've buried organic material in cold, wet soil where decomposition crawls. Most of the nitrogen won't mineralize until summer, long past the vine's primary demand window. Some of it leaches.
Incorporate too late, after full bloom on the vines, and the vine has already passed peak nitrogen uptake. You'll get some late-season N release, which isn't worthless, but it won't reduce your fertilizer need for that year's crop.
Mowing first and letting residue wilt for a week before tillage-based incorporation improves incorporation efficiency and speeds breakdown. No-till or minimal-disturbance operations (flail mowing only, no tillage) release more slowly, typically 20 to 30% lower first-year availability than fully incorporated residue, because surface residue decomposes slower than buried material. Adjust your MEF downward by 0.10 to 0.15 for surface-applied residue in no-till systems.
How do you adjust the nitrogen credit estimate for your specific soil and climate?
The MEF values in the table above are starting points, not universal constants. Several local factors push the real number up or down.
Soil texture matters. Sandy soils with low organic matter drain fast and hold less microbial biomass, so mineralization is slower and N losses to leaching after heavy rain run higher. Use the low end of the MEF range on sandy or sandy-loam soils. Clay-heavy soils hold more water and nitrogen, so you can reasonably use the mid-to-upper end.
Soil pH affects microbial activity. Below pH 5.5, bacterial decomposition slows hard and fungal communities take over, which stretches the breakdown timeline. Most vineyards target pH 6.0 to 7.0, so this rarely limits you, but acidic volcanic soils in some regions (parts of Oregon's Umpqua Valley, for one) can dampen mineralization rates noticeably.
Rainfall right after incorporation changes things fast. A 2-inch rain event within two weeks of working in a legume stand on a well-drained soil can move a real fraction of the newly mineralized nitrate out of the root zone before vines can use it. The USDA NRCS publishes leaching risk tables by soil series for the western states that help you put a number on this [4].
Soil temperature is probably the most practical dial to watch. Microbial N mineralization roughly doubles for every 18°F (10°C) rise in temperature up to about 95°F (35°C). If you incorporate into soil at 45°F and it doesn't warm past 55°F for six weeks, cut your MEF by 30 to 40% versus the standard tables.
Running multiple blocks with different soils? Keep a simple year-over-year log of credit estimates against actual petiole N at bloom. It lets you calibrate your MEF to your own ground. Three to four years of data is enough to see the pattern.
What records do you need to keep for a defensible nitrogen credit calculation?
Enough paper to reconstruct the calculation if a regulatory auditor asks two years from now. That's the whole standard.
At minimum, keep:
- Cover crop species seeded, seeding date, and seeding rate (lbs/acre)
- Inoculant records for legumes (species, lot number, application date)
- Biomass sampling date, sampling locations (GPS or block map), fresh weight per quadrat, and number of quadrats
- Dry weight calculation or the drying method used
- Tissue N analysis, ideally from a certified lab with a report you can produce on request
- The MEF value used and the reason for choosing it (C:N estimate or measured ratio)
- Incorporation date and method (disked-in, flail-mowed only, roller-crimped, and so on)
- Resulting credit in lbs N/acre and how it applied to the fertilizer plan for that block
If you're in a Nitrogen Management Plan region in California, your CCA may have a required format. Ask before building your own system so your records satisfy their reporting template [1].
Cornell Extension's New York guidelines suggest keeping records for a minimum of five years for organic input tracking in nutrient management plans [5]. That's a reasonable standard anywhere, not only New York.
VitiScribe's field record module lets you attach lab reports, log sampling data by block, and output a calculated nitrogen credit summary. Worth having if you're managing more than a handful of blocks, or if you're also keeping spray records and would rather not maintain six different spreadsheets.
Can a cover crop nitrogen credit replace synthetic fertilizer entirely in a vineyard?
Sometimes. Not always. It hinges on vine nitrogen status coming into the season, yield targets, and what the cover crop actually delivered.
Petiole tissue analysis at bloom is the ground truth for whether vines need supplemental nitrogen. The standard bloom-time sufficiency range for petiole N in Vitis vinifera runs 0.35 to 0.90% N, though it varies by variety and by the lab's own reference range [5]. If your petioles come back above 0.55% in a moderate-yield block, you almost certainly don't need extra fertilizer that season.
A well-managed legume cover crop on a medium-density stand can realistically supply 40 to 80 lbs plant-available N/acre in year one, with slow-release contributions in years two and three as residue keeps breaking down. Most vinifera vineyards targeting moderate to low vigor need somewhere between 20 and 60 lbs N/acre per season, depending on soil organic matter and yield goals. So the math can close, especially in organic or sustainable programs.
The risk is the high-vigor year. If spring rains push a flush of N from cover crop residue into already-vigorous soil in a wet spring, you can over-supply nitrogen without touching synthetic fertilizer. Monitor with petiole sampling at bloom and adjust in-season: a small fertigated N shot post-bloom if deficient, nothing more if sufficient. Set the cover crop credit plan and walk away, and it will bite you eventually.
Are there any downsides or risks to relying on cover crop nitrogen in vineyards?
Yes, and being honest about them matters more than overselling the practice.
Variability is real. Cover crop stands fail. Dry Octobers mean poor germination. Deer pressure, mowing accidents, and frost kill knock down biomass. A calculation built on a 2-ton/acre stand that only made 0.8 tons falls apart, and if you already trimmed your fertilizer order on that projection, you're short.
Timing risk. A late wet spring that delays incorporation can push the N flush out of sync with vine demand. This bites harder in maritime climates (Sonoma Coast, Willamette Valley) than in drier interior regions.
Nitrogen immobilization from grasses. If your cover crop carries a high C:N ratio and you incorporate without accounting for it, you can actually reduce vine-available nitrogen short-term. Growers who switched from legume to grass cover crops without adjusting their fertilizer program have reported vine N deficiency at bloom in the transition year.
Water competition. In dry-farmed or low-irrigation blocks, a dense cover crop stand competes with vines for spring soil moisture. Some years the N credit isn't worth the water cost. Most extension advisors recommend mowing and letting residue lie as a mulch rather than incorporating in water-stressed situations. That shifts you to the surface-residue MEF adjustment described earlier.
Pesticide carryover. Some pre-emergent herbicides used on vineyard floors have plant-back intervals that affect the next cover crop season. It isn't a nitrogen calculation issue exactly, but it affects stand establishment, and that decides the credit you can count on. Read label plant-back intervals carefully. The EPA Worker Protection Standard also requires any herbicide work in the vine row to be logged separately from cover crop operations [7].
Frequently asked questions
What is a nitrogen mineralization efficiency factor and how do I choose the right one?
The mineralization efficiency factor (MEF) is the fraction of total organic N in cover crop residue that becomes plant-available during the first growing season after incorporation. Choose it by residue C:N ratio: use 0.50 to 0.60 for legumes at early bloom (C:N below 15:1), 0.30 to 0.45 for legume-grass mixes, and 0.10 to 0.25 for mature grass residue with C:N above 25:1. Soil temperature and texture push you toward the low or high end.
Do I need to inoculate legume cover crop seed for good nitrogen fixation?
Yes, if the field hasn't grown that legume species recently. Rhizobium bacteria responsible for N fixation in vetch, bell beans, or peas are host-specific. Without adequate soil populations, nodulation is poor and you get little atmospheric N fixation. Buy fresh inoculant matched to your species, apply it at seeding, and store it out of direct sunlight. Inoculant shelf life is typically six months to one year. Skipping this on new ground is a common reason cover crop N credits underperform.
How does a no-till or roller-crimped cover crop affect the nitrogen credit compared to tillage incorporation?
Surface residue from mowing or roller-crimping decomposes slower than incorporated material because it lacks direct soil contact and the microbial interface is smaller. Expect first-season availability 10 to 15 percentage points lower than the standard MEF for tillage incorporation. So if the MEF for an incorporated legume would be 0.50, use 0.35 to 0.40 for surface-applied residue in a no-till system. The N still releases, just over a longer window, which can improve synchrony with vine demand in some conditions.
Can I use the cover crop nitrogen credit in a certified organic vineyard's nutrient plan?
Yes. Organic certification under USDA's National Organic Program requires that all inputs be documented, but there's no prohibition on counting nitrogen from incorporated cover crops as part of your nutrient management approach. The NOP encourages it. You still need to show you're maintaining or improving soil organic matter and not over-applying nitrogen. Keep your biomass sampling records, tissue N results, and the calculation methodology on file as part of your Organic System Plan.
What tissue nitrogen percentage should I use if I don't send samples to a lab?
Use published species averages as a conservative starting point: woolly pod vetch at early bloom is typically 3.5 to 4.2% N on a dry weight basis, bell beans run 3.0 to 4.0%, and cereal rye at heading runs 1.0 to 1.5%. UC ANR Leaflet 21471 has a useful table of species-specific values. Without a lab result, use the low end of the range to avoid overestimating the credit. Lab analysis costs $15 to 25 per sample and is worth it if you're managing more than a few blocks.
How many years does it take before a cover crop rotation meaningfully increases soil organic matter?
Most published studies on California vineyard soils show measurable increases in surface soil organic matter after three to five consecutive years of cover cropping, typically a 0.2 to 0.5 percentage point rise in the 0 to 6 inch layer. That takes time, and the benefit compounds: higher organic matter supports more microbial biomass, which speeds mineralization of later crop residues. Annual cover crops deliver more cumulative aboveground N than perennial grass middles, though perennial grasses build root organic matter differently.
What is the typical cost of a legume cover crop program in a California vineyard?
Seed for bell beans or vetch runs roughly $0.30 to 0.80 per pound; at typical seeding rates of 60 to 100 lbs/acre for bell beans, seed alone costs $20 to 80/acre. Add inoculant ($3 to 6/acre), seeding labor and equipment ($15 to 35/acre), and incorporation ($25 to 60/acre for disking), and you're looking at $65 to 180/acre total. That buys a nitrogen input worth $40 to 80 in ammonium sulfate equivalent, so the economic case rests on soil health, water retention, and compliance value, not nitrogen cost savings alone.
Does the nitrogen from a cover crop count as a fertilizer application for EPA Worker Protection Standard purposes?
No. Cover crop incorporation is not a pesticide application and isn't regulated under the EPA Worker Protection Standard (WPS). WPS applies to agricultural pesticides, including herbicides, fungicides, and insecticides applied in vineyards. But if you apply any pesticide to the cover crop before incorporation (for example, a burndown herbicide in a no-till system), those applications are subject to WPS requirements including restricted entry intervals and pesticide application records per 40 CFR Part 170.
How do I sample cover crop biomass accurately across a block with uneven stand density?
Use a 0.25 m² quadrat and take at least five to ten samples per block, spread across the range of stand density rather than clustered in the best-looking areas. Weigh fresh biomass per quadrat in the field, dry a pooled subsample, and calculate a dry-matter fraction. Average the dry biomass across quadrats and scale to acres. If density varies more than about 40% from one end of the block to the other, split the block into sub-zones and calculate separate credits for each.
Does petiole sampling at bloom actually reflect whether the cover crop nitrogen credit worked?
It's the best practical validation tool you have. Petiole N at bloom reflects both pre-bloom soil N availability and vine uptake, pulling together the effect of your cover crop release timing, soil conditions, and vine root activity. Compare petiole N against your lab's sufficiency range (typically 0.35 to 0.90% N for most vinifera) and against your own historical baseline for that block. Three to four years of paired data (credit estimate plus actual petiole result) lets you calibrate your MEF to your site.
Can I use a cover crop nitrogen credit to reduce fertilizer on a block that already has high soil organic matter?
Yes, and you probably should. High organic matter soils already mineralize substantial N annually, sometimes 20 to 60 lbs/acre or more from soil organic matter alone, depending on organic matter percentage and soil temperature. Stack a cover crop credit on top of that in a high-OM block and you often produce excess nitrogen. Run a complete nitrogen budget that includes both the organic matter mineralization estimate and the cover crop credit before deciding on any synthetic additions.
How does rain after cover crop incorporation affect the nitrogen credit?
Rain shortly after incorporation can cause significant nitrate leaching in well-drained or sandy soils. Nitrate is water-soluble and moves with water; a 2-inch rainfall event in sandy loam soil can move nitrate below the vine root zone before vines reach it. In high-leaching-risk situations, reduce your effective N credit by 20 to 40%. Timing incorporation to hit a dry weather window before budbreak, rather than during the rainy season, cuts this risk substantially.
What resources are available from UC Davis or Cornell for vineyard cover crop nitrogen calculations?
UC Cooperative Extension publishes species-specific cover crop N values and management guides through the UC ANR catalog; Leaflet 21471 on cover cropping in California vineyards is the most-cited reference. UC Davis Division of Agriculture and Natural Resources also maintains online nutrient management resources through its Sustainable Agriculture Research and Education Program. Cornell Cooperative Extension provides a wine grape nutrient management guide covering organic N credits. WSU Extension covers Pacific Northwest-specific species recommendations and timing.
Sources
- State Water Resources Control Board, Irrigated Lands Regulatory Program: California's Irrigated Lands Regulatory Program requires growers in most regions to track all nitrogen inputs, including organic amendments, and calculate a farm nitrogen use efficiency; Nitrogen Management Plan areas require CCA training in the method.
- UC ANR (University of California Agriculture and Natural Resources), Cover Cropping in California Vineyards, Leaflet 21471: UC Cooperative Extension research documents that a good bell bean or vetch stand can fix 100 to 200 lbs N/acre, with roughly 50 to 70% available after incorporation; species-specific tissue N values provided.
- UC Cooperative Extension, Nitrogen Management in Vineyards, UC ANR Publication 3483: Field trials on grass cover crops in California vineyards documented vine N status declining in the weeks immediately after incorporation of mature cereal cover crops due to microbial immobilization.
- Cornell Cooperative Extension, Nutrient Management Guidelines for New York and Pennsylvania Wine Grapes: Cornell Extension documents petiole N sufficiency range (0.35 to 0.90% N at bloom) for Vitis vinifera and recommends crimson clover or hairy vetch for New York vineyard interrows with tissue N of 3 to 4%.
- Washington State University Extension, Cover Crops for the Pacific Northwest: WSU Extension recommends mowing legume cover crops before seed set to maximize N contribution and reduce weed seed bank issues; Austrian winter peas suited to Pacific Northwest vineyard conditions.
- U.S. Environmental Protection Agency, Agricultural Worker Protection Standard, 40 CFR Part 170: Pesticide applications in vineyards including herbicide burndown before cover crop incorporation are subject to WPS requirements including restricted entry intervals and application records under 40 CFR Part 170.
- UC Division of Agriculture and Natural Resources, Sustainable Agriculture Research and Education Program: UC Davis SAREP maintains nutrient management and cover crop resources for California growers, including guidance on organic nitrogen credit calculations in sustainable viticulture systems.
- USDA National Organic Program: USDA NOP requires all inputs be documented in the Organic System Plan but does not prohibit counting nitrogen from incorporated cover crops; the program encourages cover cropping as part of soil fertility management.
- UC ANR, Nutrient Management in Winegrapes, UC ANR Publication 3511: UC ANR guidelines for wine grape nutrient management specify bloom-time petiole sampling as the standard validation for in-season nitrogen status and inform fertilizer adjustment decisions.
Last updated 2026-07-11