How to build a degree day accumulation spreadsheet for vineyard pest timing

TL;DR
- A degree day (DD) spreadsheet tracks heat accumulation from a biofix date to predict when vineyard pests hit damaging life stages.
- You need daily max/min temps, a base temperature for each pest, and a simple averaging formula.
- Most key thresholds come from UC Davis, Cornell, or WSU extension tables and take about 30 minutes to set up in Excel or Google Sheets.
What are degree days and why do they matter for vineyard pest timing?
Degree days measure biological time. Insects and mites don't run on the calendar. They run on heat. A grape leafhopper egg laid in April doesn't care what the date is; it hatches when it has absorbed enough warmth. Degree days capture exactly that.
The math is simple: take the average of a day's high and low temperature, subtract the base temperature (the threshold below which the pest stops developing), and the result is the degree days for that day. Add them up from a starting reference point, your biofix, and you have cumulative degree days. When that running total hits a published threshold, that pest is at the life stage the threshold describes.
Spray timing is everything. Treating eggs that haven't hatched is wasteful. Treating adults that already laid the next generation is mostly futile. The University of California Integrated Pest Management program has built action thresholds around DD totals for a dozen or more vineyard pests, and WSU's Decision Aid System pulls the same logic for Pacific Northwest growers [1][2]. You don't need those platforms to benefit from the concept, though. A spreadsheet you build yourself works fine.
The payoff is real. Research from UC Cooperative Extension found that degree day-timed applications for grape leafhopper can reduce spray events by one to two per season without sacrificing control. That's fuel, labor, and material cost off the table.
What base temperatures should I use for common vineyard pests?
Every pest species has its own base temperature, the point at which development essentially stops. Use the wrong base temperature and your accumulation drifts off by days or weeks. This is not a place to guess.
Here are the values published by UC IPM, WSU Extension, and Cornell's NEWA system for the pests most vineyard managers deal with regularly [1][2][3]:
| Pest | Base Temp (°F) | Base Temp (°C) | Common Biofix | Key DD Threshold |
|---|---|---|---|---|
| Grape leafhopper (Erythroneura elegantula) | 50°F | 10°C | Jan 1 or first adult | ~167 DD (1st egg hatch) |
| Variegated leafhopper (E. variabilis) | 50°F | 10°C | Jan 1 | ~220 DD (1st generation egg hatch) |
| Western grape leafhopper | 50°F | 10°C | Jan 1 | ~300 DD (peak 1st instar) |
| Grape mealybug (Pseudococcus maritimus) | 50°F | 10°C | Jan 1 | ~103 DD (crawler emergence) |
| Vine mealybug (Planococcus ficus) | 50°F | 10°C | Biofix trap catch | ~100-130 DD (1st crawlers) |
| Orange tortrix (Argyrotaenia franciscana) | 45°F | 7.2°C | First moth capture | ~200 DD (1st egg hatch) |
| Grape berry moth (Paralobesia viteana) | 50°F | 10°C | Biofix (trap) | ~100 DD (egg hatch, gen 1) |
| Pacific spider mite | 50°F | 10°C | Egg hatch | Monitor-based |
| Western flower thrips | 50°F | 10°C | First bloom | Shoot stage timing |
A few notes. The grape berry moth thresholds from Cornell's NEWA tool are the most rigorously validated DD model for eastern viticulture. Cornell's Network for Environment and Weather Applications explicitly states that "degree day accumulations beginning at biofix can be used to predict egg hatch, larval emergence, and adult flights" for grape berry moth [3]. WSU's Decision Aid System publishes similar logic for Willamette mite and orange tortrix in the Pacific Northwest [2]. For California pests, UC IPM's online pest management guidelines are the primary reference [1].
If you're growing where these university systems have active tools, cross-check your spreadsheet against their online models at least once per season. Your on-site temperature data is usually better than the weather station they pull from, but their biology inputs have been ground-truthed for years.
What temperature data do I need and where do I get it?
You need daily maximum and minimum temperatures. That's it. A basic min/max thermometer, a cheap weather station, or even a government CIMIS or NOAA station nearby can work.
On-site data is almost always better. Vineyard microclimates vary sharply, and a NOAA station five miles away at a different elevation can be off by 3 to 6 degrees Fahrenheit on cold nights, enough to shift a mite hatch prediction by several days. If you're serious about pest timing, a $150 to $300 wireless weather station with a data logger is the single best investment in this system. Onset HOBO loggers and the Davis Instruments Vantage Vue are the two options vineyard managers actually buy.
No on-site data? California growers can pull from CIMIS (the California Irrigation Management Information System), which runs over 145 stations statewide [4]. Pacific Northwest growers have AgWeatherNet from WSU, which provides free hourly data from over 175 stations in Washington alone [2]. East Coast growers can use the Cornell/NOAA NEWA network [3].
For your spreadsheet, you need columns for Date, Daily Max Temp, and Daily Min Temp. Everything else is calculated.
How do I calculate degree days in a spreadsheet, step by step?
There are three accepted calculation methods: the simple averaging method, the single sine method, and the double sine method. For most practical vineyard work, the simple averaging method is accurate enough and easy to audit. University extension programs often note that the sine methods are more accurate when temperatures oscillate across the base threshold within a single day, but for most days during the growing season the simple average lands within 0.5 to 1.5 DD of the more complex approaches.
Here's how to set up the spreadsheet.
Column layout (row 1 is headers):
A: Date
B: Daily Max (°F)
C: Daily Min (°F)
D: Average Temp
E: Daily DD (for one pest)
F: Cumulative DD
G: Daily DD (second pest, if tracking two)
H: Cumulative DD (second pest)
Extend this as far right as you need for multiple pests.
Step 1: Calculate daily average.
In cell D2, enter: =(B2+C2)/2
Step 2: Calculate daily degree days using the simple average method.
In cell E2, enter: =MAX(0, D2 - [base_temp])
Replace [base_temp] with the actual number, say 50 for leafhoppers. The MAX(0,...) prevents negative values on cold days, because pests don't "un-develop" below the base.
Step 3: Accumulate from biofix.
This is where most people make their first mistake. You don't want a simple running sum from January 1 unless your model calls for that. Many models use a biofix, a biological or trap-based trigger date, as Day 0.
In cell F2 (your biofix row): =E2
In cell F3: =F2+E3
Drag F3 down for the rest of the season.
If your biofix is not row 2 but, say, row 47 (some date in late April), then F47=E47 and F48=F47+E48, and cells F2 through F46 should be blank or zero.
Step 4: Add a threshold flag column.
In column G (or wherever is next), add: =IF(F2>=167, "Check 1st instar", "")
This gives you a visible alert when you pass a key threshold.
Step 5: Freeze the biofix row.
When you confirm biofix (first trap catch, first adult sighting, or the calendar trigger your model specifies), lock in that row so you don't accidentally drag the formula up. You can protect the range in both Excel and Google Sheets under the Format or Data menus.
A well-built sheet for two to three pests takes about 30 minutes to set up and about two minutes per week to update.
How do I set the biofix date correctly for each pest?
Biofix is the most important input in the whole model. A wrong biofix compounds forward through every threshold call.
Different pests use different biofix triggers, and you need to match the definition in the extension model you're following, because the DD thresholds were calibrated against that specific trigger.
For grape berry moth, Cornell's model uses biofix as the date when you have sustained male moth captures in a pheromone trap, typically defined as five or more moths per trap per week on two consecutive monitoring dates [3]. WSU uses a similar sustained-catch definition for orange tortrix.
For grape leafhopper, the UC IPM model uses January 1 as the biofix for the standard degree day accumulation because the pest overwinters as an adult and development begins whenever temperatures allow. There's no trap to pull the trigger.
For mealybugs, biofix is often pegged to crawler emergence confirmed by monitoring sticky tape wraps on the trunks or canes, not a pheromone trap catch.
In your spreadsheet, create a named cell (call it BIOFIX_DATE) and reference it in your daily DD formula so that accumulation only starts on or after that date. In Google Sheets you can do this with a simple IF: =IF(A2>=BIOFIX_DATE, MAX(0, (B2+C2)/2 - BASE_TEMP), 0). That way you only accumulate heat on days from biofix forward.
Keep a separate tab or column for your trap data. Recording weekly trap counts alongside DD gives you a ground-truth check. If your model says first flight should peak at X DD but your trap is still empty, something is off, either your biofix was too early or that pest population is genuinely delayed.
How do I handle the upper temperature threshold (upper developmental threshold)?
Some models include an upper threshold, a temperature above which development slows or stops because it's too hot even for the pest. For most common vineyard pests in the western US, upper thresholds are not routinely applied in field-level models because temperatures rarely stay above them for full days. But if you're in a hot interior appellation, like parts of the San Joaquin Valley or eastern Washington during August heat spikes, upper thresholds can matter.
The adjusted formula for the simple method with both thresholds looks like this:
Daily DD = MAX(0, MIN(daily_avg, upper_threshold) - base_threshold)
So if the base is 50°F and the upper is 90°F, and you had a 100°F max and 70°F min, your daily average is 85°F, which is below the upper threshold, so daily DD = 85 - 50 = 35. If the average were 95°F, you'd cap it: MIN(95, 90) - 50 = 40.
For grape leafhopper, UC IPM does not commonly apply an upper threshold in their published accumulation model [1]. For western grape berry moth models, WSU has used an upper threshold of 86°F (30°C) in some versions of their work [2]. Check the specific publication your thresholds come from to see whether the model was built with or without the upper cap, then match it.
If you're unsure, run the model both ways for a season and compare your predictions to actual field observations. That's how the extension folks validated these models in the first place.
What are the key action thresholds I should build into my spreadsheet?
Thresholds vary by pest, model version, and region. The table in the base temperature section above covers the entry points. Here are the fuller sets for the pests where good published data exists.
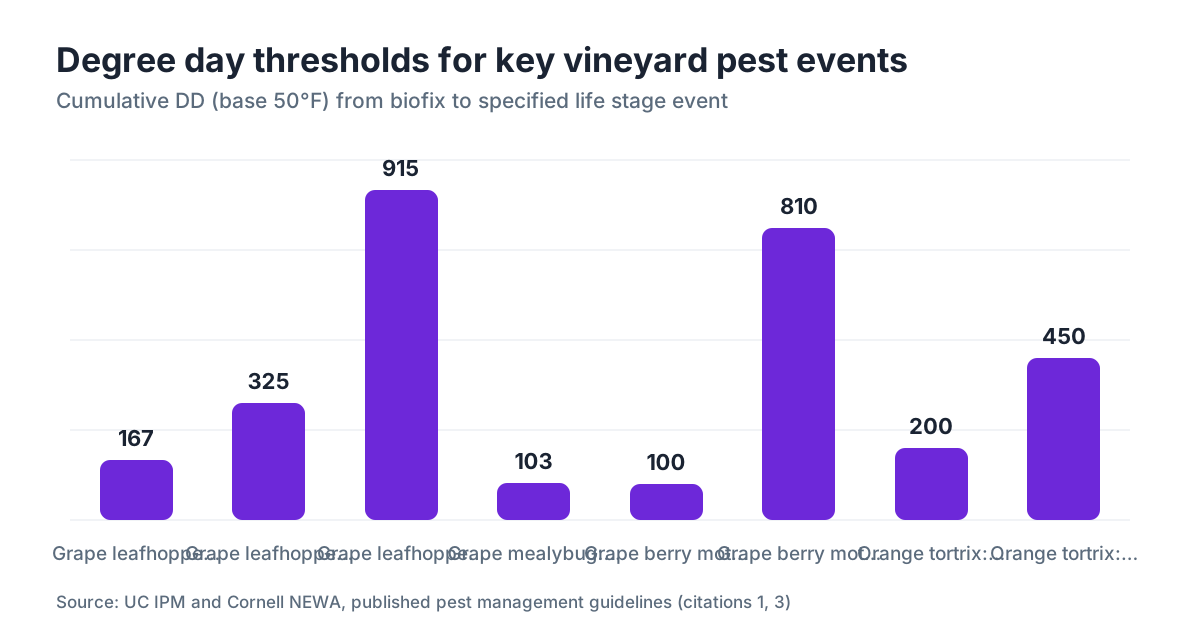
Grape berry moth (eastern US, Cornell NEWA model): [3]
- 100 DD after biofix: 1st generation egg hatch begins
- 250 DD: Peak 1st generation larval activity
- 810 DD: 2nd generation biofix (new moth flight, reset accumulation)
- 1,620 DD: 3rd generation egg hatch
Grape leafhopper (California, UC IPM): [1]
- 167 DD (base 50°F, from Jan 1): 1st egg hatch
- 325 DD: Peak 1st instar nymphs (best timing for intervention)
- 915 DD: 2nd generation egg hatch
Vine mealybug (California): [1]
- 103 DD after overwintering generation biofix: crawler emergence
- Re-accumulate from each generation's biofix for subsequent crawler pulses
Orange tortrix (Pacific Northwest, WSU): [2]
- ~200 DD after first adult biofix: egg hatch
- ~450 DD: Peak larval activity
Build these as named cells or a reference table on a separate tab. Your threshold-flag formula in the main data sheet can then pull from that reference table, so when Cornell updates a threshold you only change it in one place.
One honest caveat: these thresholds represent population averages from the environments where the models were built. Your local population may be running a few days ahead or behind. Track your own observations (actual first instar counts, first egg mass sightings) against your DD predictions for two to three seasons and you'll develop a local correction factor if one is needed.
How do I track multiple pests on the same spreadsheet without creating a mess?
The cleanest architecture uses one tab per pest and a summary dashboard tab that pulls from each.
Each pest tab has the same column layout: Date, Max, Min, Average, Daily DD (pest-specific base), Cumulative DD, and a threshold status column. You enter the temperature data once on a "weather" tab and reference it across all pest tabs with a simple cell reference (='Weather'!B2 for the date column, etc.). That way you only type temps in one place.
The summary tab is a simple table: one row per pest, showing the current cumulative DD, the next threshold, the gap to that threshold, and a status flag. A vineyard manager glancing at this tab on Monday morning should see in 30 seconds which pests are approaching a treatment window and which aren't.
For record-keeping and compliance, that summary tab also documents that you made spray decisions based on scouting and pest modeling rather than a calendar. That matters under the EPA Worker Protection Standard [5], which requires employers to keep pesticide application information and, where state regulations require it, supporting records that justify timing. Some state departments of agriculture have started asking for this kind of documentation during pesticide use audit reviews.
If you're already using a field operations platform, VitiScribe can store your spray records alongside scouting notes and generate the application documentation required under WPS. But a spreadsheet alone handles the degree day math just fine.
Visit our vineyard hub for deeper field operations content. Growers at all scales, from boutique mountain winery operations to larger south coast winery estates, use some version of this system.
Can I use free online tools instead of building my own spreadsheet?
Yes, and for several pests the online tools beat anything you'd build in an afternoon. The honest answer is: use both.
Cornell's NEWA (Network for Environment and Weather Applications) is free, covers grape berry moth and several other grape pests, and lets you select a nearby weather station or upload your own data [3]. It does the degree day math, shows you where you are relative to thresholds, and generates reports. It's well-maintained and the biology inputs are peer-reviewed.
UC IPM's online degree day calculator at ipm.ucanr.edu runs accumulations for dozens of California pests using CIMIS station data [1]. You pick the pest, the station, and the date range, and it hands back the numbers. Fast and reliable.
WSU's Decision Aid System (DAS) covers Pacific Northwest pests and integrates weather from AgWeatherNet [2].
So why build your own spreadsheet at all? A few reasons. Your on-site weather data is usually more accurate than the nearest station these tools pull from. You can combine pest tracking, spray records, scouting notes, and cost-of-application data in one document in a way no public tool does. When you're standing in the vineyard without cell service, a downloaded spreadsheet works and a web app doesn't. And some pests or local population dynamics in your specific valley may fall outside the standard tools.
My actual recommendation: use the university online tools to validate your spreadsheet in year one, then trust your local data going forward.
What does a complete degree day spreadsheet template look like?
Here's the full tab structure for a production-ready vineyard DD workbook.
Tab 1: Weather
Columns: Date | Station/Source | Daily Max (°F) | Daily Min (°F) | Notes
One row per day from January 1 (or your earliest biofix) through October 31.
Tab 2: Pest Reference
A lookup table with: Pest Name | Base Temp (°F) | Upper Threshold (°F, if applicable) | Biofix Definition | Key DD Thresholds (one column per threshold, labeled)
This is your single source of truth for biology inputs. Update it when extension programs revise their models.
Tab 3+: One per pest (e.g., "Grape Berry Moth", "Leafhopper", "Vine Mealybug")
Columns: Date | Max (pulled from Weather tab) | Min (pulled from Weather tab) | Average | Daily DD | Cumulative DD | Threshold Check
At the top of each pest tab, hardcode: Biofix Date, Base Temp (pulled from Pest Reference tab), and a cell showing Current Cumulative DD.
Tab N: Dashboard
A summary table showing each pest, its current cumulative DD, next threshold name, DD remaining to that threshold, and a color-coded status (green = more than 50 DD out, yellow = within 50 DD, red = at or past threshold). In Google Sheets, you can automate the color coding with conditional formatting on that status column.
Tab N+1: Spray Records
For WPS compliance and state pesticide use records, this tab should capture: Application Date | Product | EPA Registration Number | Rate | Target Pest | Applicator | REI | PHI | DD at Time of Application [5].
Linking the spray record to the DD log gives you a documented justification for timing that holds up in an audit.
The whole workbook, once built, runs itself. You enter two numbers per day (max and min temps) and everything updates.
How do I validate that my spreadsheet is calculating correctly?
The fastest validation check is to run a historical year through your spreadsheet and compare the output to a known year from a university extension record.
UC IPM and Cornell both publish case examples with temperature data and expected DD accumulations. Take a month of published daily temps, run them through your formulas, and compare your cumulative DD to the expected values. If they match within 1 to 2 DD over a 30-day period, your math is right.
A second check: use the UC IPM online calculator [1] or Cornell NEWA [3] for a current-season date range using the nearest official weather station. Enter that same station's data into your spreadsheet. The outputs should match closely. Any gap larger than 3 to 5 DD over a month usually traces back to a different base temperature being used, a different handling of temperatures that cross the base threshold mid-day, or a data entry error.
Common errors to look for:
- Forgetting to apply MAX(0,...) so negative DD values pull down the cumulative total
- Starting accumulation from the wrong row (pre-biofix days contributing to the count)
- Using Celsius temps in a Fahrenheit-based model, or vice versa
- Rounding intermediate values when the formula should carry full precision
Once you've validated the formula logic, spot-check actual pest observations against your DD predictions. First instar leafhoppers showing up consistently 10 days before your model predicts? Your local population may be running warmer than the nearest weather station suggests, or your biofix date is systematically late. Track this over three seasons and you'll have a locally calibrated correction.
For growers who want their scouting observations and DD records in one place, VitiScribe's record-keeping system lets you log field notes alongside spray records with timestamps that map back to your accumulation data. But again, the spreadsheet alone is fully functional.
How do degree day records help with pesticide compliance and worker protection?
The EPA Worker Protection Standard (40 CFR Part 170) requires agricultural employers to provide pesticide application information to workers and handlers, maintain records of applications, and post safety information at a central location [5]. It doesn't specifically mandate a DD justification record. But several states, including California, have layered on their own requirements.
California's Department of Pesticide Regulation requires growers to file a Pesticide Use Report (PUR) within one month of each application, including the target pest and site [6]. A DD log that shows your application was timed to a documented pest development stage is the strongest possible answer to an inspector's question about why you applied on a given date.
Beyond the regulatory angle, there's the practical one. Crop insurance adjusters, third-party auditors for retail and restaurant customers, and sustainability certification bodies (CCOF, SIP, LODI, Fish-Friendly Farming) increasingly ask for integrated pest management documentation [7]. A DD spreadsheet tied to spray records is exactly the paper trail that satisfies those requests without extra work, because you built it as an operational tool, not a compliance theater exercise.
The EPA's pesticide registration number requirement for spray records is worth flagging: every product applied must be identified by its full EPA registration number on your application record [5]. Build that column into your spray records tab from day one. Missing registration numbers are one of the most common findings in pesticide use audits.
Keep your workbook backed up. A season's worth of degree day data represents real operational value. Cloud storage (Google Drive, OneDrive) with version history handles this automatically.
Frequently asked questions
What's the simplest degree day formula I can use in Excel or Google Sheets?
Use =MAX(0, (daily_max + daily_min)/2 - base_temp) for each day, then build a running sum from your biofix date. That's the simple averaging method. It's accurate within 1 to 2 degree days per day of more complex sine-curve approaches for most mid-season vineyard conditions. Replace base_temp with 50 for leafhoppers or mealybugs, 45 for orange tortrix.
Do I need to accumulate degree days year-round or just during the growing season?
It depends on the pest. For grape leafhopper, UC IPM's California model accumulates from January 1 using a base of 50°F, so yes, you start from the new year. For pests with a trap-based biofix like grape berry moth or orange tortrix, you only accumulate from the biofix date, which is typically late March through May depending on your region. Most models skip the summer gap between generations and reset accumulation at each new generation's biofix.
What's the difference between degree days and growing degree days used for vine phenology?
Vine phenology models (like Winkler heat summation) usually use a base of 50°F and accumulate from April 1 to October 31 to classify your climate region. Pest degree day models use pest-specific base temperatures, pest-specific biofix dates, and are calibrated to specific biological events like egg hatch or crawler emergence, not vine stage. The underlying math is the same; the biology inputs are different. Don't mix the two in the same running total.
How accurate are degree day models compared to actual field scouting?
Degree day models predict population-level timing with reasonable accuracy, typically within 5 to 10 days for peak life stage events under normal conditions. They're tools for narrowing your scouting window, not replacements for it. UC IPM explicitly recommends combining DD predictions with physical scouting confirmation before making spray decisions. Local weather variability, microclimate effects, and population genetics can all shift timing relative to the model.
Where do I find grape berry moth degree day thresholds?
Cornell's NEWA system (newa.cornell.edu) is the primary source for grape berry moth DD thresholds in the eastern US. The model uses a base temperature of 50°F and biofix defined as sustained male moth captures in pheromone traps. Key thresholds: 100 DD for 1st generation egg hatch, 810 DD for 2nd generation adult flight. Cornell Extension publications provide the full generation-by-generation threshold table.
Can I use a smartphone weather app temperature instead of a weather station?
You can, but accuracy suffers significantly. Consumer weather apps pull from the nearest NOAA or commercial station, which may be miles away and at a different elevation. A 2 to 3°F daily error compounds over a season into 30 to 60 DD of accumulated error, enough to throw off a treatment window by a week. For meaningful pest timing decisions, a $150 to $300 on-site min/max logger at canopy height is worth the cost.
What are the degree day thresholds for vine mealybug in California vineyards?
UC IPM guidelines indicate vine mealybug crawler emergence begins at approximately 100 to 130 degree days (base 50°F) after overwintering female biofix. Vine mealybug has three to four generations per year in the Central Valley, so you reset accumulation at each new generation's biofix. Monitoring with trunk tape wraps confirms actual crawler presence and validates your DD prediction before applying a treatment.
Is there a free degree day spreadsheet template I can download?
UC IPM and several state extension programs offer downloadable Excel templates linked from their pest management guidelines pages. The UC IPM website (ipm.ucanr.edu) has a degree day calculator with downloadable output. Cornell's NEWA site has a data export function. These are good starting points, but you'll typically need to adapt the template to your specific pest mix, biofix definitions, and spray record requirements.
Do degree day models work the same way in cool coastal regions versus hot inland valleys?
The formula is the same, but cool coastal climates accumulate degree days more slowly, so thresholds hit later in the calendar. This can mean fewer pest generations per season. In very cool regions, some pests may not complete a second generation at all. Hot inland valleys can push through three or four mealybug generations per season. Always use DD totals, not calendar dates, as your trigger. The model compensates for climate automatically if your temperature data is accurate.
How do I handle missing temperature data days in my spreadsheet?
For short gaps of one to two days, interpolate by averaging the values from the days before and after. For longer outages, pull data from the nearest official weather station for those dates and note the substitution in your records. Don't leave gaps as zero, because that artificially slows your cumulative total. Document any substituted data in a notes column so your records are transparent if reviewed later.
What should my spray record tab include to satisfy WPS and state requirements?
At minimum: application date, product name, EPA registration number, active ingredient, rate per acre, total volume applied, treated acreage, target pest, applicator name, restricted entry interval (REI), pre-harvest interval (PHI), and field identification. California additionally requires this in a Pesticide Use Report filed within one month. Adding a column for cumulative DD at time of application ties your spray record to your pest timing model and documents the IPM basis for the decision.
How many years of local degree day data should I collect before trusting my model?
Two seasons of paired observations (DD prediction versus actual field scouting confirmation of the pest life stage) is enough to identify a systematic bias if one exists. Three seasons gives you enough variation in weather years to know whether your correction factor holds. Most university extension programs validated their models over five to ten years of field data, so you won't replicate that rigor, but you can calibrate for local conditions meaningfully in two to three seasons.
Can degree day models help time dormant oil or delayed-dormant spray applications?
Yes, though the models are simpler. Dormant-season applications for scale insects and mite eggs are often timed to vine phenology stages (delayed dormant, bud swell) rather than pest DD accumulations. However, for pests like European red mite, UC IPM does use early-season DD accumulation from egg hatch to time first miticide applications. Check the specific UC IPM or WSU guidelines for the pest you're targeting in dormant or delayed-dormant timing.
Sources
- UC IPM, University of California Integrated Pest Management Program - Grape Pest Management Guidelines: Base temperatures, degree day accumulation models, and action thresholds for grape leafhopper, vine mealybug, and other California vineyard pests.
- WSU Extension - Decision Aid System and AgWeatherNet: Pacific Northwest degree day models for orange tortrix and grape berry moth, base temperatures, and integration with AgWeatherNet weather station data.
- Cornell University NEWA - Network for Environment and Weather Applications, Grape Berry Moth Model: Grape berry moth degree day thresholds: biofix definition as sustained trap catch, 100 DD for 1st generation egg hatch, 810 DD for 2nd generation adult flight.
- California Department of Food and Agriculture - CIMIS (California Irrigation Management Information System): CIMIS operates over 145 weather stations statewide providing free daily max/min temperature data for use in pest degree day models.
- EPA - Worker Protection Standard, 40 CFR Part 170: WPS requires agricultural employers to maintain pesticide application records, post safety information, and provide application details to workers and handlers.
- California Department of Pesticide Regulation - Pesticide Use Reporting: California requires growers to file a Pesticide Use Report within one month of each application, including target pest, product, and site identification.
- CCOF (California Certified Organic Farmers) - Certification and Compliance: Third-party sustainability certifications increasingly require IPM documentation including pest monitoring and timing records.
- UC Cooperative Extension - Grape Leafhopper Management: Degree day-timed applications for grape leafhopper can reduce spray events by one to two per season without sacrificing control efficacy.
- Cornell University Extension - Grape Berry Moth Integrated Pest Management: Cornell publication stating that degree day accumulations beginning at biofix can be used to predict egg hatch, larval emergence, and adult flights for grape berry moth.
- UC IPM - Degree Day Calculator: UC IPM's online degree day calculator allows growers to run accumulations for California pests using CIMIS station data with selectable base temperatures.
- EPA - Pesticide Registration Numbers and Labeling Requirements: EPA requires every applied pesticide to be identified by its full registration number in application records.
Last updated 2026-07-10