How to track degree day accumulations for spray timing in the vineyard

TL;DR
- Growing degree days (GDD) count heat accumulation above a base temperature, usually 50°F for grapevines and most grape pests.
- Track them with an on-site weather station or free tools like UC IPM, NEWA, or WSU AgWeatherNet, then compare to published pest thresholds to time sprays.
- Most spray windows fall between 100 and 1,620 GDD from January 1 or budbreak.
What are growing degree days and why do they matter for spray timing?
Growing degree days (GDD) count the heat a season actually delivers. Plants and insects develop on temperature, not the calendar. A late-April cold snap can push a real spray date two weeks past your May 15 note on the wall. A warm March can pull it two weeks earlier. GDD cuts through that noise.
The math is simple. Average your daily high and low, subtract a base temperature, and that's the day's GDD. Add those daily values from a start date, usually January 1 or budbreak depending on the model, and you have your season total. For grapevines and most grape pests, the base is 50°F (10°C). [1]
Here's why it matters for sprays. The timing guides from UC Davis, Cornell, and WSU are all written in GDD language. UC IPM's guidelines for mealybugs, leafhoppers, and virus vectors give threshold windows in GDD accumulated from January 1 with a 50°F base. [2] The grape berry moth models used across the East and Midwest do the same. Spray by date and you're guessing. Spray by GDD and you're reading the same signal the insects are reading.
UC IPM puts the case plainly: degree-day models "allow you to more accurately predict" pest development stages than a calendar can. [2] That's the whole reason to bother.
How do you calculate growing degree days manually?
The formula is one line: GDD = ((Tmax + Tmin) / 2) - Tbase. Take your daily high and low, average them, subtract the base temperature, and sum the daily results from your start date. A high of 78°F and a low of 52°F averages 65°F. Minus the 50°F base, that day gives you 15 GDD. [1]
Two rules keep you honest. First, cap the daily high at 95°F if you're using the average or single sine method, because most models assume development stops above that. Second, no negative days. If the average sits below 50°F, the day contributes zero, not a negative. GDD only climbs.
There's a more precise version, the single sine method, which fits a curve to the day's temperature swing instead of using a flat average. UC IPM runs this for several grape pest models. [2] The gap between methods is usually under 5%, but it compounds over a season, worst in coastal blocks with wide diurnal swings. Check which method your published pest model assumes and match it. Mixing methods is a common mistake that can throw your timing off by 50 to 100 GDD in a warm spring.
For manual tracking, a spreadsheet is plenty. Date, daily high, daily low, that day's GDD, running cumulative total. Two minutes a day to update.
What base temperature should you use for grape pest models?
For most grape models, 50°F (10°C) is the base. That covers grapevine leafroll virus vectors, grape mealybug, western grape leafhopper, grape berry moth, and general vine phenology. [1][2]
A few pests differ. The grape berry moth (Paralobesia viteana) model from Penn State and Cornell uses a 50°F base with an 86°F upper threshold. [3] The European grapevine moth (Lobesia botrana) model California adopted after its 2009 detection also used a 50°F base. Some mite models drop the base to 40°F or even 32°F, so check before you plug in numbers.
| Pest or Model | Base Temp (°F) | Upper Threshold (°F) | Start Date |
|---|---|---|---|
| General vine phenology | 50 | 95 | Jan 1 or budbreak |
| Grape berry moth (GBM) | 50 | 86 | Jan 1 |
| Western grape leafhopper | 50 | 95 | Jan 1 |
| Grape mealybug | 50 | 95 | Jan 1 |
| European grapevine moth | 50 | 95 | Jan 1 |
| Powdery mildew (Gubler-Thomas) | 50 | 95 | varies |
The Gubler-Thomas powdery mildew risk model is the odd one out. It's event-based, not a running accumulation. It watches 6-hour windows above 50°F and tracks consecutive days to assign a risk index. [4] It's temperature-driven but never produces a clean GDD number, so track it in its own column, separate from your pest totals.
Where do you get reliable temperature data for your vineyard?
You have three realistic options, roughly in order of accuracy for your specific block: an on-site weather station, a network station within two miles, or NOAA historical data fed into a model.
On-site stations are the best. A basic Davis Instruments Vantage Vue or Onset HOBO runs roughly $500 to $800 and logs temperature, humidity, and sometimes leaf wetness at whatever interval you set. [5] You own the raw data, it's tuned to your elevation and microclimate, and you don't have to wonder whether the nearest airport sits in a frost pocket or on a baking tarmac. In mountain vineyards or anything with real elevation change, a single off-site station can be 5 to 8°F off on a cold night.
No on-site station? UC IPM's degree day calculator pulls from CIMIS (California Irrigation Management Information System) stations. You pick a nearby station, set your base and upper threshold, and it returns cumulative GDD. [2] Cornell's Network for Environment and Weather Applications (NEWA) does the same for the Northeast and Mid-Atlantic, free. WSU's AgWeatherNet covers Washington and Oregon. [6][7]
NOAA's Climate Data Online lets you download historical daily max/min for any airport or co-op station, which is how you compare this year to the long-term average. [8] If your model says spray at 810 GDD and you're sitting at 780 with a warm week coming, that comparison tells you how many days you've got.
One honest limit: none of the free tools capture your canopy microclimate. Under a dense July canopy, temperatures can run 3 to 5°F above ambient. For coarse spray timing, that rarely changes the call. For fine-tuning a trap threshold, it might.
What GDD thresholds should trigger a spray for common vineyard pests?
Here are real thresholds from published extension sources. Treat them as starting points, not replacements for scouting.
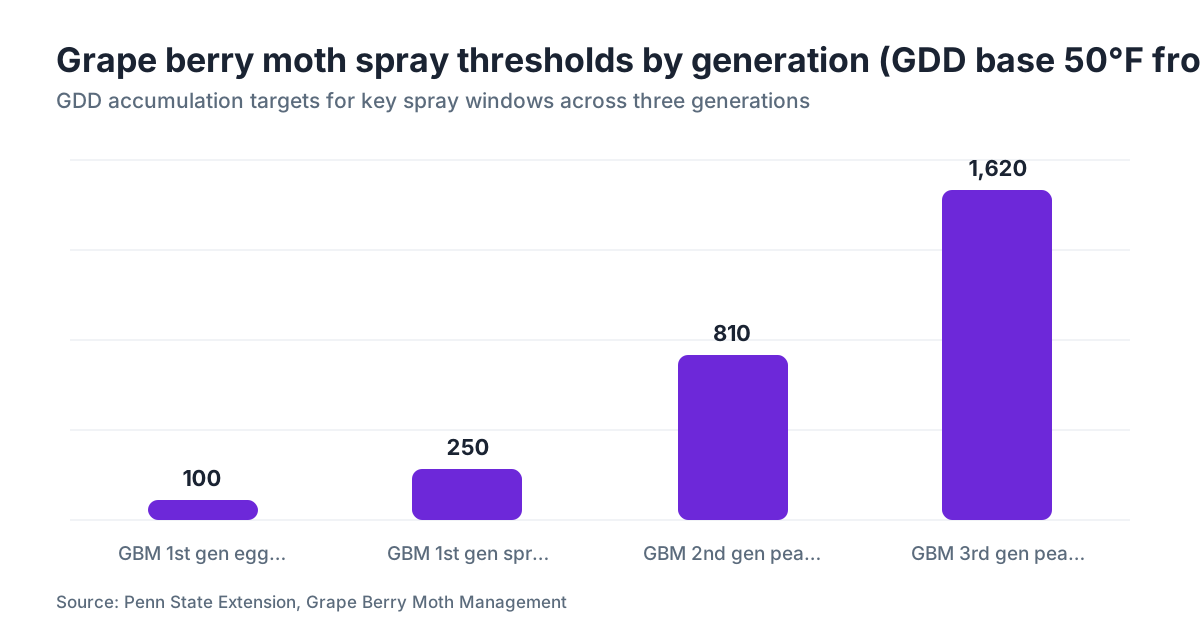
Grape berry moth (Eastern US): The Penn State and Cornell model marks three flight periods. First-generation egg hatch begins around 100 GDD (base 50°F, from January 1), and the spray window for first-generation larvae runs roughly 100 to 250 GDD. Second generation peaks near 810 GDD, third near 1,620 GDD. [3] These are the best-documented GDD thresholds of any eastern grape pest.
Western grape leafhopper (California): First-generation nymphs show up around 300 to 350 GDD (base 50°F, from January 1). Economic thresholds shift by region and variety, but start monitoring at 250 GDD. [2]
Grape mealybug (California): First-generation crawlers emerge roughly 200 to 300 GDD (base 50°F) from budbreak. A dormant or early-season oil application usually goes on before 100 GDD post-budbreak. [2]
Powdery mildew (Gubler-Thomas, California): This one doesn't accumulate GDD in the usual sense. It scores each day 0, 1, or 2 based on 6-hour windows between 50°F and 95°F. Three straight days at index 2 puts you in high risk. Plenty of California advisors run the Gubler-Thomas index and basic GDD side by side. [4]
Botrytis (general): No single accepted GDD model exists. Most advisors time applications by phenological stage, bloom through bunch closure, paired with humidity and rainfall records. Wait on a GDD number alone for Botrytis and you're ignoring the moisture that actually drives it.
The EPA Worker Protection Standard (WPS) sets no spray timing thresholds, but it requires application records, including dates, times, and products, be kept for two years after application. [9] Tying your GDD log to that spray record makes the whole package harder to argue with if you're ever audited.
How do you set up a simple degree day tracking system from scratch?
Start with your data source. On-site station? Read or export max/min daily. No station? Bookmark the nearest CIMIS, NEWA, or AgWeatherNet station and fold it into your morning routine.
Pick your start date. January 1 is the common choice for pest models because it's consistent across years. Some models want budbreak, which works but means you have to record your actual budbreak date. Write it down. Every year. It takes 30 seconds and you will need it.
Build the spreadsheet. Five columns: date, Tmax, Tmin, daily GDD, cumulative GDD. Floor the daily GDD at zero with a MAX formula: =MAX(0, ((B2+C2)/2)-50). The cumulative column is a running sum. Tracking several pests with different bases or start dates? Add a cumulative column for each.
Add a threshold row for every pest model you care about. Bold it or color it red. When your running total crosses that line, you scout hard and probably spray.
Set a weekly reminder to update the sheet. Daily is better, but fall three or four days behind and you can backfill from the same network stations. Most free weather networks let you pull the past 7 to 30 days without an account.
Want all of this sitting next to your spray records and application logs? VitiScribe connects weather data to spray events and keeps your records WPS-compliant, which earns its keep once one spreadsheet is trying to cover multiple blocks with different pest pressure.
Save your data at season's end. Year-over-year GDD comparisons pay off. A season running 200 GDD behind average in April tends to compress the spray schedule in June when the heat arrives. Knowing that early changes how you plan.
How do pheromone traps and GDD tracking work together?
Pheromone traps catch adult moths and beetles and tell you flight is happening now. GDD models tell you when to expect that flight before you see a single moth. Run them together and each covers the other's blind spot.
For grape berry moth, the standard move is to deploy traps by 50 GDD (base 50°F, from January 1) so you're monitoring before first flight. [3] When trap catches climb past the action threshold (often 5 to 10 moths per trap per week, though it varies by state), you've confirmed what the model predicted. If catches are high but your GDD says you're still three weeks from predicted egg hatch, something's off. Either your temperature data is wrong or your local population runs earlier than the published threshold.
That cross-check is where the real value lives. Models are built on population averages. Your local biotype might run slightly earlier or later. After two or three seasons recording both trap catch dates and the GDD at trap peak, you can calibrate the model to your own site. Calendar programs never get near that kind of precision.
Record trap counts with the GDD accumulated that same day. The date alone, without the GDD next to it, does almost nothing to improve your model next year.
How do you handle GDD tracking when temperatures vary across vineyard blocks?
This is the problem nobody talks about enough. A vineyard with 200 feet of elevation change can show 10 to 15% different GDD between the bottom and top of the hill by July. Cold air drains downhill, valley floors stay cooler at night, ridgetops shed heat fast but warm fast in the morning. The pest pressure at the bottom may sit a full spray application ahead of the top.
Have multiple stations? Assign a GDD log to each and track blocks by their nearest station. Worth every dollar if your vineyard has real topographic spread.
One station only? Place it at the elevation representing most of your planted acreage and accept that your number is an approximation for the outlier blocks. When you're unsure, scout those blocks more often around predicted thresholds instead of trusting the model to the day.
Block-level GDD records also help your vineyard documentation. Asked why Block 3 got a spray on a day Block 1 didn't? Your block-level GDD log answers it. That's a cleaner defense than "the calendar said so."
For multi-block operations, log GDD by block rather than by whole farm. It's more work, but the precision earns its keep when you're calling spray decisions on 10 varieties across changing ground.
What records do you need to keep alongside your GDD log for compliance?
The EPA Worker Protection Standard (WPS) under 40 CFR Part 170 requires employers keep records of all pesticide applications for two years. [9] Each record needs the product name, EPA registration number, active ingredient, application date, location treated, and the name of the handler who applied it. GDD data isn't required by WPS, but any agricultural commissioner or pesticide inspector reads a well-kept GDD log as proof of an informed spray decision.
In California, Pesticide Use Reports (PURs) go to the county agricultural commissioner monthly. [10] The data in your PUR should match your spray records exactly. A GDD log attached to each spray event gives you a contemporaneous scientific reason for the timing, which helps if a spray gets questioned after a drift complaint or a residue exceedance.
Cornell Extension recommends keeping GDD logs alongside IPM records for at least three years to support USDA programs and crop insurance claims. [7] Good practice no matter what state you farm in.
A format that works: for each spray, record the date, cumulative GDD at application, the pest or disease targeted, product and rate, EPA reg number, handler name, and a one-line note on why you sprayed (threshold reached, trap catch trigger, scouting observation). That package answers everything a reviewer can ask, and it takes about four minutes per application.
Are there free online tools that calculate degree days automatically?
Yes, and several are genuinely good and have run for years.
UC IPM's Degree Day Calculator (ipm.ucanr.edu) lets you pick a California CIMIS station, set your base and upper threshold, choose a method (average, single sine, or double sine), and pull cumulative GDD from any start date. [2] It also overlays pest event markers for common grape pests. This is the California tool.
Cornell's NEWA (newa.cornell.edu) covers the Northeast, Great Lakes, and several Mid-Atlantic states. It runs integrated pest models, grape berry moth included, and reports cumulative GDD next to trap catch risk ratings. [7] It's free, it's been running since the early 2000s, and its grape berry moth model is well-validated.
WSU AgWeatherNet (weather.wsu.edu) covers Washington, Oregon, and parts of Idaho with similar GDD tools. It's the standard reference for Pacific Northwest grape pest timing. [6]
NOAA's Climate Data Online (ncdc.noaa.gov/cdo-web) doesn't compute GDD, but it lets you download daily max/min for any station nationwide to feed your spreadsheet. [8] Handy for historical comparisons and for sites the state networks miss.
Running multiple blocks with different pest profiles? The free tools work, but you'll burn time copy-pasting data between them and your records. That's the case for a purpose-built system like VitiScribe, where GDD data links straight to spray logs and compliance records with no manual transfer.
How accurate are degree day models really, and where do they fall short?
Honest answer: far better than the calendar, not precise to the day. The Penn State grape berry moth model has been validated across multiple years and regions and predicts first adult flight within 5 to 7 days most years. [3] That's the gold standard. Other models have thinner validation histories.
Models break down in extreme weather years. A sharp cold snap after a warm March suppresses pest development in ways a simple accumulation curve doesn't capture. Drop from 75°F to 35°F for 10 days in April and most models just pause accumulation and resume, but the insect population may have taken real mortality, which shifts the effective threshold. No free model handles that well.
Models also assume your temperature data is accurate and representative. A station in full sun or beside a heat-soaking wall overstates GDD. UC Davis Plant Sciences recommends siting weather stations at vine canopy height, in representative shade, away from pavement and structures. [1] Almost nobody does this perfectly. Accept some error.
And models describe averages. Your local biotype of grape berry moth or leafhopper may consistently run ahead of or behind the published curve. Three seasons of traps alongside GDD tracking will tell you which way your site leans. Adjust accordingly. Nobody has clean data on site-specific biotype variation, but your own multi-year trap records beat any generic model.
Frequently asked questions
What start date should I use for GDD accumulation in the vineyard?
January 1 is the standard start date for most published grape pest models, including grape berry moth and western grape leafhopper. Some vine phenology models use budbreak instead. Whatever you pick, stay consistent year over year and record your actual budbreak date every season. Mixing start dates across years makes your multi-year comparisons meaningless.
Can I use daily average temperature from a weather app instead of actual max/min data?
You can, but it adds error. Phone apps round temperatures and often pull from stations nowhere near your vineyard. The GDD formula needs daily maximum and minimum, not an averaged or "feels like" reading. For rough planning it's fine. For real spray timing, use a proper weather station or a validated network like CIMIS, NEWA, or WSU AgWeatherNet.
How many GDD do I need before the first grape berry moth spray?
The Cornell and Penn State grape berry moth model targets the first-generation spray window starting around 100 GDD (base 50°F, from January 1), with the main egg hatch window running roughly 100 to 250 GDD. Second-generation target sits near 810 GDD, third near 1,620 GDD. Confirm with pheromone trap catches before you pull the trigger on any spray.
Do I need to track degree days for powdery mildew, or is there a different model?
Powdery mildew in California is tracked with the Gubler-Thomas risk index, which is temperature-based but not a simple GDD accumulation. It scores each day 0 to 2 based on how many hours fall between 50°F and 95°F. Three straight days at index 2 means high risk. Many advisors run Gubler-Thomas alongside basic GDD. In wetter eastern climates, infection models based on temperature and leaf wetness hours are more common.
What's the difference between the average method and the single sine method for calculating GDD?
The average method uses (Tmax + Tmin) / 2 minus the base. The single sine method fits a sine wave to the daily temperature curve and calculates how much of it sits above the base. The sine method is more accurate, especially when temperatures hover near the base threshold. UC IPM's online calculator uses single sine. For most spray decisions, the difference is under 5% across a season.
How do I know if my local weather station data is accurate enough to use?
Cross-check it. On the same day, compare your station's max/min to the nearest CIMIS, NEWA, or airport ASOS reading. A 2 to 3°F difference is normal given microclimate. A steady 6°F gap or more means your station is poorly sited, usually too much sun or too close to pavement, and it will overstate GDD. Fix sensor placement before the season and note any calibration issues in your records.
How long should I keep degree day and spray records?
The EPA Worker Protection Standard requires pesticide application records be kept for two years. Cornell Extension recommends three years for USDA program and crop insurance purposes. California requires Pesticide Use Reports be filed monthly and retained as the county agricultural commissioner requires, generally two to three years. Keeping GDD logs alongside spray records for the same period is good practice and costs nothing extra.
Can degree day tracking help with fungicide spray timing the way it does with insecticides?
Yes, with caveats. Fungal disease models like Gubler-Thomas for powdery mildew and various Botrytis risk models are temperature-driven and use some form of heat accumulation. Botrytis models typically combine temperature with humidity and wetness hours rather than plain GDD. For downy mildew, the Goidanich and similar infection models use temperature and rainfall, not GDD alone. So GDD is one input, but fungal decisions usually need weather event data too.
What's the best way to track degree days for multiple vineyard blocks?
Assign a data source, an on-site station or the nearest validated network station, to each block or group of adjacent blocks with similar elevation and exposure. Keep a separate GDD column per block in your spreadsheet. When blocks diverge because of elevation or aspect, you can make independent spray calls. This matters most in vineyards with more than 100 feet of elevation change across blocks.
Are there any USDA or state programs that require GDD tracking?
No federal program explicitly mandates GDD tracking. USDA's National Organic Program (NOP) does require organic growers to document the basis for pest management decisions, and a GDD log is strong supporting evidence. Some state Pest Management Alliance grants and Sustainable Agriculture Research and Education (SARE) reporting ask for IPM documentation that implicitly includes this kind of data. Check your specific program requirements.
How do I handle gaps in my temperature data when my weather station goes down?
Pull historical data from the nearest network station for the missing days and note the substitution in your log. NOAA's Climate Data Online and most state agricultural weather networks let you download recent historical max/min free. Flag any gap longer than three days. For compliance, a documented substitution beats a blank field every time. If your station drops out often, invest in a backup battery system.
What's a realistic time investment to maintain a GDD tracking system?
About five to ten minutes a day if you're entering data by hand from an external station. Less if your station exports automatically or you use a web tool like NEWA or UC IPM's calculator. End-of-season review takes an hour or two. Building the spreadsheet template takes a few hours once. After that, it's close to zero marginal time on top of your normal morning weather check.
Do degree day models work differently in hot desert climates versus cool coastal regions?
Yes. In desert climates like parts of the San Joaquin Valley or southern Arizona, GDD piles up fast and pest generations compress. You can hit second-generation grape berry moth thresholds weeks early. In cool coastal regions, accumulation is slow and erratic, and some pests never finish a full third generation. The same model applies in both, but the calendar dates when you cross thresholds land far apart. This is exactly why calendar spraying fails in variable climates.
Sources
- UC Davis Department of Viticulture and Enology: Base temperature of 50°F (10°C) for grapevine and grape pest degree day accumulation; upper threshold of 95°F used in standard models; weather station siting at canopy height in representative shade
- UC IPM, University of California Agriculture and Natural Resources, Grape Pest Management Guidelines: Degree-day models allow more accurate prediction of pest life stage timing than calendar-based approaches; GDD thresholds for leafhopper and mealybug; online degree day calculator using CIMIS stations
- Penn State Extension, Grape Berry Moth Management: Grape berry moth model uses base 50°F, upper threshold 86°F; first-generation egg hatch near 100 GDD, spray window 100 to 250 GDD, second generation near 810 GDD, third near 1,620 GDD; predicts first adult flight within 5 to 7 days most years
- UC IPM, Gubler-Thomas Powdery Mildew Risk Index for Grapes: The Gubler-Thomas model assigns a risk index of 0, 1, or 2 based on 6-hour temperature windows between 50°F and 95°F; three consecutive days at index 2 indicates high risk
- Davis Instruments, Vantage Vue Weather Station specifications and pricing: Basic on-site weather station suitable for vineyard GDD logging available in the $500 to $800 price range
- WSU AgWeatherNet, Washington State University: AgWeatherNet provides GDD calculation tools and weather data for Washington, Oregon, and parts of Idaho for grape pest timing
- Cornell University NEWA, Network for Environment and Weather Applications: NEWA provides free GDD calculation and integrated grape berry moth pest models for the Northeast, Great Lakes, and Mid-Atlantic; Cornell Extension recommends keeping GDD logs alongside IPM records for at least three years
- NOAA National Centers for Environmental Information, Climate Data Online: NOAA Climate Data Online provides downloadable daily max/min temperature records for ASOS airport and co-op stations nationwide for GDD calculations and historical comparisons
- US EPA, Agricultural Worker Protection Standard, 40 CFR Part 170: The Worker Protection Standard requires pesticide application records including dates, products, and handler names be kept for two years after application
- California Department of Pesticide Regulation, Pesticide Use Reporting: California growers must file Pesticide Use Reports to the county agricultural commissioner monthly documenting all pesticide applications
Last updated 2026-07-09