How to calculate vine evapotranspiration from weather station data
TL;DR
- Vine evapotranspiration (ETc) equals reference ET (ETo) multiplied by a crop coefficient (Kc).
- Calculate ETo from your weather station with the FAO-56 Penman-Monteith equation using daily temperature, humidity, wind, and solar radiation.
- Then multiply by a vine Kc that runs from about 0.15 at budbreak to 0.70 at mid-season.
- Most western U.S.
- growers skip the math and pull ETo straight from CIMIS or AZMET.
What is vine evapotranspiration and why does it matter for irrigation scheduling?
Evapotranspiration is the combined water loss from soil evaporation and plant transpiration. For grapevines, it sets the ceiling on how much water the vineyard has to replace each day. Get it right and you irrigate to the number. Get it wrong and you're either stressing vines at the wrong time or drowning root zones and feeding disease.
The number growers care about is ETc, or crop evapotranspiration. It's calculated as:
ETc = ETo × Kc
ETo is reference evapotranspiration, a standardized measure of atmospheric demand based on a short, well-watered grass reference. Kc is the crop coefficient, a dimensionless multiplier that translates grass-reference demand into vine-specific demand at a given growth stage. [1]
Water districts in California, Washington, and Oregon increasingly ask growers to document irrigation decisions, so the math earns its keep. A defensible ETc record also helps under EPA's Worker Protection Standard, which requires keeping pesticide application records tied to field conditions, and under state water board programs that ask for applied-water accounting. [2]
What weather variables do you need to calculate ETo?
You need four measured weather inputs plus two fixed site parameters. The FAO-56 Penman-Monteith equation is the international standard for ETo, and it's the one UC Davis, Cornell, and WSU extension programs all recommend. [3] The four measured inputs sit at or near canopy height (typically 2 meters):
- Maximum and minimum air temperature (°C)
- Relative humidity or dew-point temperature (to derive actual vapor pressure)
- Wind speed (m/s) at 2 m height, or measured at another height and adjusted with a log-law correction
- Solar radiation (MJ/m² per day), or sunshine hours if radiation isn't directly measured
The two fixed site parameters are elevation (meters above sea level, for atmospheric pressure) and latitude (for calculating extraterrestrial radiation on days when you estimate from sunshine hours rather than a pyranometer).
If your station measures net radiation rather than incoming solar, you can substitute it directly after accounting for soil heat flux, which FAO-56 treats as negligible on a daily time step. [1]
Check your anemometer height right now. Most Davis Instruments and Onset HOBO stations mount the wind sensor at 3 m. FAO-56 assumes 2 m. The correction is:
u2 = uz × (4.87 / ln(67.8z − 5.42))
where uz is measured wind speed and z is height in meters. [1] At 3 m, that trims measured wind by about 6 percent. Small, but do it anyway.
How do you run the FAO-56 Penman-Monteith equation step by step?
This is the full daily ETo calculation from raw weather data. Build it once in a spreadsheet and you'll see exactly where each input lands.
The equation is:
ETo = [0.408Δ(Rn − G) + γ(900/(T+273))u2(es − ea)] / [Δ + γ(1 + 0.34u2)]
Variables:
- Rn = net radiation at crop surface (MJ/m²/day)
- G = soil heat flux density (MJ/m²/day); set to 0 for daily calculations
- T = mean daily air temperature (°C) = (Tmax + Tmin) / 2
- u2 = wind speed at 2 m height (m/s)
- es = saturation vapor pressure (kPa)
- ea = actual vapor pressure (kPa)
- Δ = slope of saturation vapor pressure-temperature curve (kPa/°C)
- γ = psychrometric constant (kPa/°C)
Step 1: Calculate saturation vapor pressure.
es = (e°(Tmax) + e°(Tmin)) / 2
where e°(T) = 0.6108 × exp(17.27T / (T + 237.3))
Step 2: Calculate actual vapor pressure from minimum relative humidity or dew point.
If you have dew-point temperature Tdew: ea = 0.6108 × exp(17.27 × Tdew / (Tdew + 237.3))
If you have mean RH: ea = (RH/100) × es
Step 3: Calculate the slope of the vapor pressure curve.
Δ = 4098 × [0.6108 × exp(17.27T / (T + 237.3))] / (T + 237.3)²
Step 4: Calculate the psychrometric constant.
γ = 0.665 × 10⁻³ × P
where P = 101.3 × [(293 − 0.0065 × elevation) / 293]^5.26
Step 5: Calculate net radiation. If your station measures incoming solar radiation Rs:
Rns (net shortwave) = (1 − 0.23) × Rs
Rnl (net longwave) requires Tmax, Tmin, ea, and clear-sky radiation. The full FAO-56 longwave formula is in Chapter 3 of FAO Paper 56 (Allen et al., 1998). [1]
Rn = Rns − Rnl
Step 6: Plug everything into the main equation. The result is ETo in mm/day.
It reads like a lot. One Google Sheet handles it cleanly once you set up the column structure. UC ANR's irrigation publications include worked examples with real station data that walk through every number. [3]
Can you use free public weather networks instead of doing the math yourself?
Yes, and most experienced irrigators do exactly that. Public networks run the Penman-Monteith math for you and publish daily ETo you can pull in seconds.
CIMIS (California Irrigation Management Information System) runs over 145 automated weather stations across California and publishes daily and hourly ETo. [4] You can pull data for any station by zip code or coordinates through the web interface or the free API. CIMIS uses a modified Penman equation at some stations and publishes which method applies.
AZMET (Arizona Meteorological Network) does the same for Arizona, calculating both grass and alfalfa reference ET from 29 stations. [5]
WSU's AgWeatherNet covers Washington State with Penman-Monteith ETo for more than 190 stations. [6]
In Oregon, the Bureau of Reclamation's AgriMet network publishes ET data for irrigated sites.
Stuck in a gap between stations? FAO-56 lets you borrow ETo from a station up to 50 km away in flat terrain, though accuracy falls apart in mountainous ground where local inversions and wind patterns differ sharply. For those spots, running your own station and doing the calculation pays off.
For on-site calculation from a private station, the Ref-ET software from the University of Idaho runs the full FAO-56 math from a CSV export of your logger data. [7] It's not pretty. It works.
What crop coefficient (Kc) values should you use for grapevines?
Start with FAO-56 Annex 8 defaults, then correct for your actual canopy. This is where vineyard ET splits hardest from textbook irrigation agronomy. Grapevines are odd: widely spaced, often partly shaded, sometimes carrying a cover crop, and trained in ways that swing canopy area and transpiration per unit ground.
FAO-56 Annex 8 gives Kc ini of 0.30, Kc mid of 0.70, and Kc end of 0.45 for standard conditions with minimal ground cover. [1] Those are fair starting points for a bilateral cordon vine on a warm, dry site with no cover crop. They'll overestimate a young vine at 30 percent canopy closure and underestimate a mature, hedgerow-trained vine with dense shoots.
A more practical framework for wine grapes scales Kc by fractional canopy shading (Sf). The Heilman-Trout-Williams approach, published in the American Journal of Enology and Viticulture, finds:
Kc ≈ 1.18 × Sf + 0.07 (for the vine fraction alone, without a cover crop) [8]
Measure Sf by photographing the canopy shadow at solar noon on a clear day and dividing shaded area by row spacing times vine spacing. A mature Cabernet canopy at veraison might shade 50 to 60 percent of the ground, giving Kc in the 0.66 to 0.78 range, close to the FAO mid-season value. A year-two vine might shade 15 percent, giving Kc around 0.25.
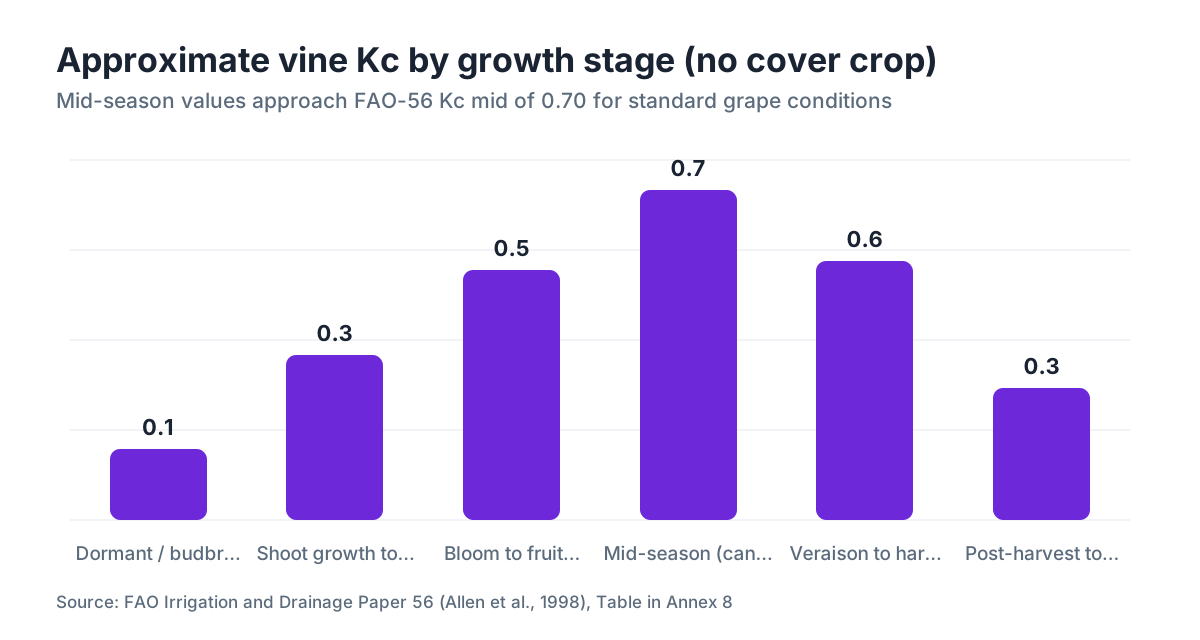
| Growth Stage | Approximate Kc (no cover crop) | Notes |
|---|---|---|
| Dormant / budbreak | 0.10 to 0.20 | Evaporation-dominated |
| Shoot growth (6-inch to bloom) | 0.25 to 0.45 | Rising fast |
| Bloom to fruit set | 0.45 to 0.60 | |
| Mid-season (canopy fill) | 0.55 to 0.75 | Highest demand |
| Veraison to harvest | 0.45 to 0.65 | Deficit irrigation common here |
| Post-harvest to dormancy | 0.20 to 0.35 |
Add 0.05 to 0.15 to any of these if you keep a permanent full-cover grass or legume cover crop between rows. The cover crop transpires on its own account, and that water comes from somewhere. [1]
For Paso Robles operators and other growers in hot, low-humidity climates, Kc mid values at the top of these ranges are more likely to match real vine demand. See our guide to paso-robles-wineries for the local heat picture.
How do you account for deficit irrigation and vine water stress in the calculation?
ETc as calculated above is the water a vine would use under well-watered conditions. That's rarely the target. A lot of premium wine grape production in California, Washington, and Australia runs vines at mild to moderate stress during late berry development to hold vigor down and concentrate flavor.
FAO-56 handles this with a water stress coefficient, Ks:
ETc adj = Ks × Kc × ETo
Ks runs from 0 (complete stress, stomata closed) to 1.0 (no stress). Most moderate deficit programs for wine grapes target Ks in the 0.6 to 0.9 range from veraison through harvest. The catch: you can't get Ks from a weather station. You need soil water measurements or pressure bomb stem water potential readings to place the vine on the depletion curve. [1]
WSU extension publishes a practical guide pairing ETc with pressure bomb thresholds for Riesling and Cabernet Sauvignon in the Yakima Valley. It puts stem water potential targets between -8 and -12 bars at mid-day for moderate stress in reds during berry maturation. [6]
Here's the workflow most growers actually run: calculate ETc to know the full replacement target, irrigate to some fraction of it (say 60 to 70 percent of ETc after veraison), then verify vine status weekly with a pressure bomb. The ET math sets the water budget. The pressure bomb tells you whether the vine agrees.
How accurate is this method, and what are the common error sources?
Penman-Monteith ETo lands within 5 to 10 percent of measured values under standard conditions when sensors are clean and properly sited, per a multi-site validation study published in Agricultural Water Management. [9] The bigger error sources in vineyard use are these four.
Sensor calibration drift. Pyranometers collect dust fast in summer, especially in Central Valley or Yakima conditions. A dirty dome can cut measured radiation by 20 to 30 percent, which drags your ETo down with it. Clean the dome with a lint-free cloth weekly during the dry season.
Kc uncertainty. A fixed Kc from FAO-56 tables can miss a specific block by 20 to 40 percent when canopy architecture is non-standard. If you're using the season water balance for cost accounting or water district reporting, spend one hour per season measuring canopy shading fractions from a photograph and recalibrate.
Station siting. A station inside the vineyard reads differently from one at a nearby airport or research plot. Warm air trapped between rows, slower wind inside the trellis, and modified humidity from vine transpiration all pull readings away from the open-area values Penman-Monteith assumes. Put your station in an open spot near the block, never in the middle of the canopy.
Rain and dew. On mornings with dew or light rain, real transpiration drops. FAO-56 doesn't adjust for this. If daily ETo comes out high on a day where vines stayed wet until noon, flag it and manually cut the ETc estimate or leave it out of your irrigation trigger accumulator.
What is the weekly and seasonal water budget workflow in practice?
The math earns its keep only when it drives a weekly schedule. Here's the workflow most consultants in California's North Coast and Washington's Columbia Valley run.
Daily step: Pull ETo from your station or CIMIS/AgWeatherNet. Multiply by today's Kc to get ETc in mm. Convert to inches if needed (1 mm = 0.039 inches). Subtract rainfall over 0.1 inches; smaller events don't reach the root zone in most summer conditions.
Weekly step: Sum the daily ETc deficit since the last irrigation. When the cumulative deficit hits your management allowed depletion (MAD), typically 40 to 50 percent of plant-available water in the root zone, schedule an irrigation set.
Seasonal step: Sum total ETc from budbreak through harvest. A mature Cabernet block in Napa under standard conditions uses roughly 18 to 24 inches of ET over the season, depending on heat accumulation and vine age. A young block might use 8 to 12 inches. Total applied water should roughly match the ETc total minus winter stored soil moisture and growing-season rainfall.
Keep spray records and irrigation logs in a platform like VitiScribe, and tying each day's ETc to a block record gives you a single water use log that covers operations and reporting without rebuilding spreadsheets in December.
For system calibration: know your emitter flow rate and vine spacing, then convert ETc to hours of runtime:
Runtime (hours) = ETc (gallons/vine/day) / emitter flow rate (gph)
How do you validate your ET estimates against real vine water use?
Calculated ETc is a model output, not a measurement, so check it against a real-world signal now and then.
The simplest check is a soil water budget. Know your soil's field capacity and wilting point (from a USDA Web Soil Survey lookup or a lab texture analysis), track irrigation and rainfall, then compare your calculated depletion over a two-week window to the change in soil moisture measured by a capacitance or neutron probe at the same depths. If calculated depletion runs 20 percent higher than measured depletion week after week, your Kc is probably too high. [1]
A second check is sap flow. Thermal dissipation or heat-pulse sensors measure actual water movement through the trunk in real time. They cost roughly $800 to $2,000 per vine for a research-grade setup and need data logging, but for a research block or a large operation they give the most direct read on vine transpiration short of a weighing lysimeter. A 2019 paper in Irrigation Science found Penman-Monteith ETc estimates fell within 8 to 15 percent of sap flow measurements across six Cabernet Sauvignon sites in California when growers used site-specific Kc values instead of FAO-56 defaults. [10]
For most vineyard managers without research gear, the pressure bomb is the best practical validator. If your calculated ETc and irrigation schedule hold vines at target stem water potential week after week, the model is working well enough.
What resources and tools make this easier?
You don't have to build a spreadsheet from scratch. Every tool below is free or cheap and covers the full FAO-56 workflow.
FAO-56 (Allen et al., 1998, FAO Irrigation and Drainage Paper 56) is the foundational text. It's a free PDF from the FAO site and holds every equation, table, and worked example in one place. [1]
Ref-ET Software (University of Idaho): free Windows software that calculates ETo from several methods including FAO-56 Penman-Monteith, straight from a CSV data file. Available through the University of Idaho's Kimberly R&E Center. [7]
CIMIS (California Department of Water Resources): free web portal and API with daily and hourly ETo for 145+ California stations, plus downloadable historical records. [4]
WSU AgWeatherNet: free ETo for 190+ Washington stations, with historical downloads and a grape-specific irrigation scheduling tool. [6]
AZMET (University of Arizona): free ET data for Arizona with daily summaries going back to 1987. [5]
UC ANR Publication 3431 (Irrigation of Agricultural Crops) covers vineyard ET and Kc estimation in a California context with worked examples. [3]
Cornell Cooperative Extension publishes practical Penman-Monteith guides for New York vineyard irrigation, worth reading if you're east of the Rockies, where humidity is higher and the vapor pressure deficit term carries more weight relative to radiation. [11]
Want your irrigation logs, ETc calculations, and spray records in one place instead of scattered across spreadsheets and paper? VitiScribe was built for that kind of field record integration. The calculations above still work fine in Excel or a CIMIS export.
Are there simpler ET methods that work well enough for small vineyards?
Penman-Monteith is the standard, but it isn't the only option. For a small vineyard without a full weather station, a couple of shortcuts hold up.
Hargreaves-Samani equation. This uses only maximum and minimum temperature plus extraterrestrial radiation (calculated from date and latitude, no sensor needed). The formula is:
ETo = 0.0023(Tmean + 17.8)(Tmax − Tmin)^0.5 × Ra
where Ra is extraterrestrial radiation in mm/day equivalent. Hargreaves-Samani typically runs 10 to 20 percent less accurate than Penman-Monteith but performs well in semi-arid climates where radiation tracks temperature range closely. [1] For a small Paso Robles or Yakima block with no humidity or radiation sensor, it beats guessing.
Pan evaporation method. A Class A evaporation pan measures atmospheric demand directly. Multiply pan evaporation (in/day) by a pan coefficient (typically 0.7 to 0.8 in vineyard settings with upwind fetch) to get ETo, then apply Kc as usual. It's older and less precise than Penman-Monteith, but a pan runs $150 to $300 for a complete setup and reads daily with no data logging.
Full weather stations that transmit to a logger and automate the Penman-Monteith calculation cost roughly $1,500 to $4,000 for vineyard-grade equipment (Davis Instruments Envoy or similar). Manage more than 20 irrigated acres and the water and energy savings usually cover that cost within two or three seasons.
Frequently asked questions
How often should I update my Kc during the season?
At minimum, shift Kc at three points: when the canopy closes over the row middles (typically bloom to fruit set), at veraison if you switch to deficit irrigation, and at harvest when you cut off irrigation or drop to post-harvest rates. Some consultants update Kc every two to three weeks by measuring canopy shading fractions. More frequent updates buy better accuracy, but the returns shrink unless you're managing very high-value blocks.
What units does the Penman-Monteith equation output and how do I convert to gallons per vine?
The equation outputs ETo in mm/day. To convert to gallons per vine per day: multiply mm/day by 0.0394 to get inches/day, then by your vine spacing in square feet divided by 144, then by 7.48. For a vine on 6x8 ft spacing, 5 mm/day of ETo at Kc of 0.65 works out to roughly 0.08 gallons per vine per day.
Can I use CIMIS data if my vineyard is 15 miles from the nearest station?
Generally yes, with caveats. In flat terrain with similar elevation and no large water bodies between you and the station, CIMIS ETo is reliable within 10 to 15 percent at that distance. In hilly terrain, coastal fog zones, or valley floors with temperature inversions, the error grows quickly. CIMIS publishes a spatial interpolation tool that estimates ETo at any point, which beats simple station substitution.
Does a cover crop between vine rows significantly change my ETc calculation?
Yes. A permanent grass or legume cover crop in full growth can add 0.10 to 0.25 to your effective Kc, a real bump in water demand. FAO-56 handles it by splitting Kc into a transpiration component (Kcb) and an evaporation/cover-crop component. Mow frequently and keep the cover short, and the ET addition drops. Bare-cultivated midrows push the cover-crop term to near zero.
What's the difference between ETo and ETr, and which should I use for grapes?
ETo is reference ET based on a short grass reference (think golf fairway). ETr uses a tall alfalfa reference and runs roughly 15 to 25 percent higher under the same conditions. CIMIS publishes ETo. AZMET publishes both. Grapevine Kc values in FAO-56 and UC Davis literature are calibrated against the grass reference, so use ETo. Pair ETr with ETo-calibrated Kc values by mistake and you'll over-irrigate.
How do I calculate extraterrestrial radiation (Ra) if I don't have a solar radiation sensor?
Ra depends only on latitude and day of year, both fixed. FAO-56 Table 2.6 (or an online FAO calculator) gives Ra in MJ/m²/day for each latitude and month. From Ra you can estimate incoming solar radiation Rs using the Hargreaves-Samani or Angstrom equations, then run the full Penman-Monteith calculation. UC Davis and WSU extension spreadsheets pre-populate Ra columns automatically from station coordinates.
Does vine row orientation affect the ET calculation?
Row orientation affects how much radiation the canopy intercepts and how vines compete for light, which shifts actual transpiration. The Penman-Monteith ETo calculation itself doesn't change with orientation because it's built from weather, not canopy geometry. But your site-specific Kc should account for it: north-south rows in high-sun climates intercept more radiation across the day than east-west rows and often show slightly higher transpiration.
How do I handle missing weather data in my ET calculation?
For gaps of one or two days, gap-filling from the nearest CIMIS or AgWeatherNet station is reasonable if you note the substitution in your records. For temperature and humidity, a simple average of the day before and after works for short gaps. Don't interpolate solar radiation over more than one day; it swings too hard with cloud cover. Missing wind data is often filled with the station's long-term monthly mean, imperfect but better than dropping the day.
What weather station setup does a typical 10-acre irrigated vineyard need?
At minimum: air temperature and relative humidity at 2 m, a pyranometer or silicon-cell solar radiation sensor, a cup or ultrasonic anemometer at 2 to 3 m, and a data logger recording hourly averages. A complete system from Davis Instruments (Vantage Pro2 Plus) or Onset HOBO runs $800 to $2,000 depending on sensors. Add a tipping-bucket rain gauge. You can skip a net radiometer if your solar sensor is calibrated; FAO-56 estimates the longwave term from temperature and humidity.
How does ETc calculation change in cool, humid climates like Willamette Valley or Finger Lakes?
In humid climates the vapor pressure deficit term in Penman-Monteith shrinks because the air is already partly saturated. ETo values run lower (often 3 to 5 mm/day at mid-season versus 7 to 9 mm/day in the Central Valley), and Kc values calibrated in California will overestimate demand if applied straight. Cornell Cooperative Extension publishes Kc tables specific to New York conditions. Humidity sensor accuracy matters more in the East, because small errors in ea propagate harder when (es-ea) is small.
Is there a regulatory reason to calculate and record ETc in a vineyard?
A growing number of California groundwater sustainability agencies under SGMA require irrigators to report applied water volumes, and some tie those reports to ETc-based benchmarks. Several Colorado River basin states use ET-based allocation frameworks. EPA's Worker Protection Standard doesn't require ET calculations directly, but water board reporting in California and Washington increasingly asks for irrigation water use accounting that a documented ETc-based schedule satisfies most cleanly.
Can I use ETc to estimate vine water stress, or do I need a pressure bomb for that?
ETc tells you how much water the atmosphere is pulling from the vine under current weather. It doesn't tell you how stressed the vine actually is, because vine water status also depends on soil water availability, root depth, and stomatal behavior. A pressure bomb (stem water potential) or dendrometer band reads vine stress directly. Use ETc to manage the water budget and the pressure bomb to confirm the vine agrees with your model.
How does canopy management like hedging or leaf pulling change my Kc mid-season?
Both cut canopy fraction, so both lower Kc. A hard summer hedge that removes 20 to 30 percent of shoot tips typically drops canopy shading fraction by 5 to 10 percentage points, which reduces Kc by roughly 0.05 to 0.12 using the Heilman-Trout-Williams relationship. If you hedge, remeasure canopy shading fraction the following week and update Kc for the rest of the season. Skip that adjustment and you'll over-irrigate.
What is management allowed depletion (MAD) and how does it connect to ETc scheduling?
MAD is the fraction of plant-available soil water you let deplete before irrigating. For grapevines in active growth, most guidelines set MAD at 40 to 50 percent. Figure the total plant-available water in the root zone (soil texture and depth set this), then irrigate when accumulated ETc deficit reaches MAD × total available water. The ETc accumulator resets to zero after each irrigation event that refills the root zone to field capacity.
Sources
- FAO, Irrigation and Drainage Paper 56 (Allen et al., 1998), Crop Evapotranspiration: FAO-56 Penman-Monteith equation, Kc values for grapes (Kc ini 0.30, Kc mid 0.70, Kc end 0.45), wind height correction, deficit irrigation Ks coefficient, and cover crop ET adjustments
- EPA, Agricultural Worker Protection Standard (40 CFR Part 170): EPA Worker Protection Standard record-keeping requirements for pesticide application conditions in field operations
- UC Agriculture and Natural Resources, UC ANR Publication 3431, Irrigation of Agricultural Crops: UC Davis and UC ANR recommended Penman-Monteith ETo calculation and vineyard Kc estimation methods for California
- California Department of Water Resources, CIMIS (California Irrigation Management Information System): CIMIS network of 145+ stations providing daily and hourly Penman-Monteith ETo for California vineyards and farms
- University of Arizona, AZMET (Arizona Meteorological Network): AZMET 29-station network providing grass and alfalfa reference ET calculated daily for Arizona agricultural users
- Washington State University, AgWeatherNet: WSU AgWeatherNet 190+ station network with Penman-Monteith ETo, stem water potential targets for Yakima Valley wine grapes, and grape irrigation scheduling tools
- University of Idaho, Kimberly Research and Extension Center, Ref-ET Software: Ref-ET is free software from University of Idaho that calculates FAO-56 Penman-Monteith ETo from imported weather station CSV data
- American Journal of Enology and Viticulture, Heilman, Trout, Williams, vineyard Kc from canopy shading fraction: Kc ≈ 1.18 × Sf + 0.07 relationship between fractional canopy shading (Sf) and vine crop coefficient, published in AJEV
- Agricultural Water Management journal, global validation of FAO-56 Penman-Monteith ETo across 11 climate zones: FAO-56 Penman-Monteith ETo is accurate within 5 to 10 percent under standard conditions across a range of climates, per multi-site validation study
- Irrigation Science journal, sap flow vs. Penman-Monteith ETc comparison in California Cabernet Sauvignon vineyards (2019): Penman-Monteith ETc estimates were within 8 to 15 percent of sap flow measurements across six Cabernet Sauvignon sites when site-specific Kc values were used
- Cornell Cooperative Extension, vineyard irrigation and Penman-Monteith ET guidance for New York: Cornell CCE published Kc tables and Penman-Monteith guides calibrated to humid, cool New York vineyard conditions
Last updated 2026-07-11