Setting up a vineyard weather station for irrigation decisions
TL;DR
- A well-sited vineyard weather station measuring temperature, humidity, wind, solar radiation, and rainfall lets you calculate reference evapotranspiration (ETo) and pair it with soil moisture sensors for defensible irrigation calls.
- Hardware runs $800 to $4,000 depending on sensor count.
- UC and WSU extension both publish validated crop coefficient tables to translate raw ETo into vine water demand.
Why does a dedicated vineyard weather station matter for irrigation?
Airport weather data is close to useless for scheduling vine irrigation. Temperature, humidity, and wind speed can differ by 20 percent or more between a valley floor and a hillside block half a mile away, and those gaps compound into large errors when you're trying to figure out how much water your vines actually lost to evapotranspiration overnight [1].
The logic is short. Irrigation decisions are only as good as the evapotranspiration estimate behind them. Evapotranspiration (ET) is the combined water loss from soil evaporation and plant transpiration. To get ET, you calculate reference evapotranspiration (ETo) from local weather parameters, then multiply by a crop coefficient (Kc) matched to your grapevines at their current growth stage. If your weather data comes from a station five miles away, at a different elevation, in a different microclimate, your ETo is wrong before you even start.
A station on your own dirt also feeds your spray records and frost triggers, so it earns its keep more than once. If you're already logging pesticide applications and keeping worker safety documents under the EPA Worker Protection Standard [2], tying weather records to those logs is a short step from work you do already.
Regional networks like CIMIS in California or AgWeatherNet in Washington are good supplements and good for cross-checking your sensor calibration. They don't replace on-site data in vineyards with real topographic and microclimate variation [3].
Which sensors do you actually need for ETo-based irrigation scheduling?
The Penman-Monteith equation, standardized by the Food and Agriculture Organization as FAO-56 and used by most university extension programs, needs four measured variables: air temperature, relative humidity, wind speed at 2 meters height, and solar radiation (shortwave incoming) [4]. Rainfall is a fifth parameter you have to track so you can subtract effective precipitation from your irrigation budget.
Here's what each sensor does in the calculation:
| Sensor | Parameter measured | Why it matters for ETo |
|---|---|---|
| Air temperature (min/max) | °C or °F | Drives vapor pressure deficit, the engine of water demand |
| Relative humidity | % | Combined with temp gives actual vs. saturation vapor pressure |
| Wind speed (at 2 m) | m/s | Wind strips the boundary layer from leaves, speeding vapor loss |
| Solar radiation (pyranometer) | MJ/m² per day | Often the single largest driver of ETo on clear days |
| Rain gauge (tipping bucket) | mm | Subtracts from gross irrigation requirement |
Soil moisture sensors sit apart from the weather station but they close the loop. The weather station tells you how much water the vine theoretically used. Soil sensors confirm whether that water actually ran out in the root zone. Read the two streams together and you avoid both under- and over-irrigation [5].
Some systems offer an optional leaf wetness sensor. It's genuinely useful for disease pressure models (powdery mildew, botrytis) but it costs money and does little for pure irrigation scheduling. Add it if your disease budget justifies it. Skip it if you're only solving the irrigation problem this year.
What does a vineyard weather station cost, and which brands are worth considering?
Entry-level stations from Davis Instruments (Vantage Pro2 series) land in the $600 to $900 range for the console and sensor suite. The standard anemometer mounts at the unit rather than on a separate 2-meter mast, which can throw off wind speed. Adding a proper pole and cabling to get the anemometer to the FAO-recommended 2-meter height costs another $100 to $200.
Mid-range agricultural stations from Onset HOBO, Campbell Scientific, and Meter Group (formerly Decagon) run $1,500 to $4,000 depending on sensor count and whether they include cellular telemetry. Telemetry matters more than people expect. A station you have to physically visit to download data is a station you'll stop using during the busy weeks when irrigation calls matter most.
The table below gives rough cost ranges by tier:
| Station tier | Typical cost (hardware only) | Connectivity | ETo output? |
|---|---|---|---|
| Consumer (Davis Vantage Pro2) | $600-$900 | Wi-Fi / optional cellular | Requires software add-on |
| Agricultural mid-range | $1,500-$2,500 | Cellular included | Often built-in |
| Research-grade (Campbell) | $2,500-$4,000+ | Cellular or logger | Yes, with programming |
Nobody has clean independent cost-per-acre breakeven data for small vineyards. WSU Extension's Pacific Northwest irrigation guidance notes that over-irrigating wine grapes commonly cuts fruit quality and adds input costs that can outrun the hardware cost of proper monitoring within a few seasons [6]. That's not a precise payback figure, but the direction is clear.
Running under 20 acres on a tight budget? California's CIMIS network is free and covers most wine regions, so it gives you a solid ETo baseline. Add one cheap temperature and humidity logger on-site to check for microclimate offsets, and you have a reasonable middle step before you commit to a full station.
Where should you physically place the weather station in a vineyard?
Siting is where most DIY installs fall apart. The WMO and FAO guidelines are specific. Put the station over short grass or bare soil representative of your irrigated area, away from buildings or tall vine rows that make turbulence or shade the pyranometer, with the anemometer at exactly 2 meters above ground [4].
In a vineyard that's hard to pull off in the middle of the rows. Most growers site the station in an alleyway or at the perimeter on the prevailing-wind side. The errors to dodge: placing the station under or right beside the canopy (which shades the solar sensor and distorts humidity), placing it within 10 meters of a building (wind turbulence), or mounting the anemometer above 2 meters without a wind speed correction factor.
If your vineyard has blocks with meaningfully different aspects, elevations, or soil types, one station won't catch the variation. Plenty of operations end up running two or three. Start with one at the block you're least sure about, not at headquarters where it's convenient to glance at.
On sloped sites, both UC and WSU extension programs point out that cold air drainage on calm nights creates frost pockets and humidity differences a ridge-top station will miss completely [1]. Your irrigation station and your frost sensor don't have to be the same unit.
How do you calculate vine water demand from ETo?
Once your station is logging ETo, you convert it to crop evapotranspiration (ETc) by multiplying by a grapevine crop coefficient (Kc). The formula is ETc = ETo x Kc. That single line is the whole translation from raw weather to vine water demand.
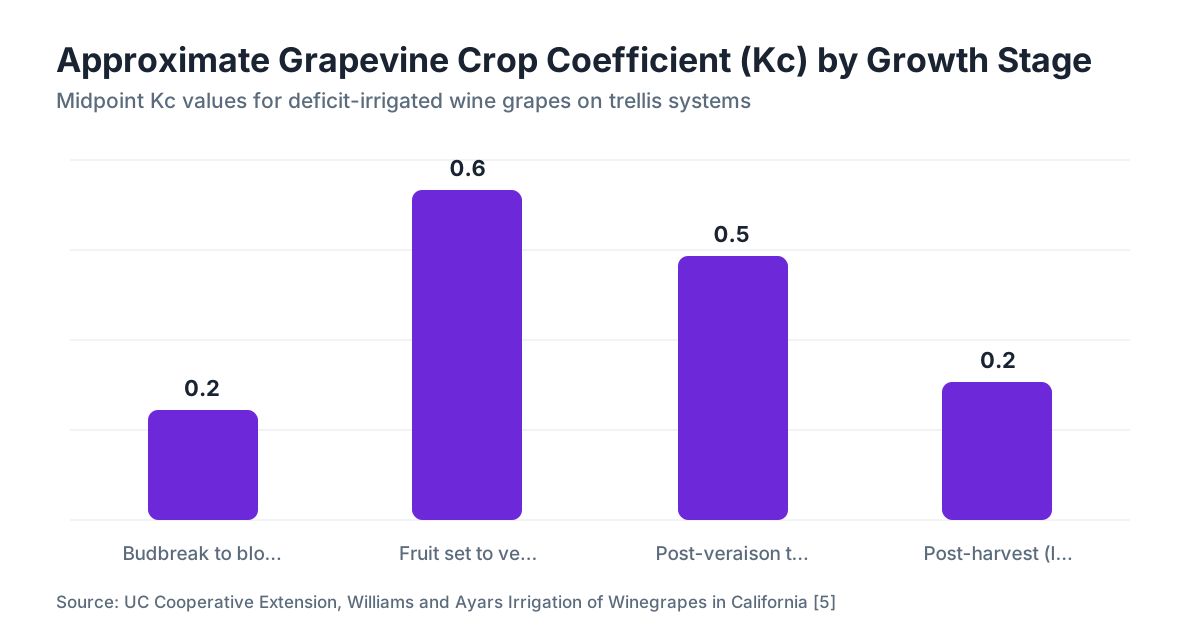
Kc values for wine grapes shift by growth stage and training system. UC Cooperative Extension, in work by Williams and Ayars, published coefficients for deficit-irrigated wine grapes that are widely used across California [5]. A simplified version looks like this:
| Growth stage | Approximate Kc (wine grapes, trellis, moderate leaf area) |
|---|---|
| Budbreak to bloom | 0.15 - 0.25 |
| Fruit set to veraison | 0.50 - 0.70 |
| Post-veraison to harvest | 0.40 - 0.55 |
| Post-harvest (leaf on) | 0.20 - 0.30 |
These are approximations. Real Kc depends on vine spacing, canopy size, whether you're running deficit irrigation, and your local climate. FAO Irrigation and Drainage Paper 56 is the canonical reference for the underlying method, and the UC Davis Viticulture and Enology extension site publishes region-specific coefficient tables worth bookmarking [9].
The practical workflow is short. Pull daily ETo from your station (most software calculates it automatically once you have the four required sensors). Multiply by the Kc for the current growth stage. Subtract any effective rainfall recorded that day. That's your daily vine water use estimate in millimeters or inches. Compare the accumulated deficit to your target soil moisture thresholds and you have your irrigation trigger.
A word on accuracy: crop coefficients carry real uncertainty. Canopy size in particular moves ETc a lot, and a big-canopy vine on a high-vigor site can run a Kc 30 to 50 percent higher than the table suggests. Pairing Kc-based estimates with soil moisture sensor readings at rooting depth (typically 30 to 60 cm for drip-irrigated wine grapes) is the only reliable way to catch those site-specific swings.
What soil moisture sensors work best alongside a weather station?
Soil moisture sensors tell you what actually happened in the root zone, not what the weather equations predicted. Two technology types dominate vineyard use: tensiometers and electronic sensors (capacitance or TDR-based).
Tensiometers measure soil water tension (centibars) directly. They're cheap ($30 to $80 each), accurate in wet-to-moderate moisture ranges, and familiar to experienced irrigation managers. The catch: they need regular maintenance, require refilling, and go offline when tension climbs past about 80 centibars in dry soil.
Capacitance-based sensors (the Meter Group EC-5, 5TM, or TEROS 12 are common) measure volumetric water content and log continuously without maintenance. They cost $100 to $300 per sensor and integrate cleanly into the same data logger as your weather station. Cornell's Viticulture and Enology extension program has published practical placement guidance for Northeast vineyards, recommending sensors at two depths (30 cm and 60 cm) to capture both surface drying and deeper root-zone status [7].
For a minimum viable setup, install two sensors per representative block, one at 30 cm and one at 60 cm, inside the drip emitter zone. That tells you whether your irrigation wets the full root zone or just the top layer. WSU Extension recommends siting sensors where you expect average vine performance within the block, not the weakest or strongest vine, so you don't act on outlier data [6].
How do you connect weather data to your irrigation records and compliance logs?
Most record-keeping rules for pesticide and irrigation management want you to log weather conditions at or near the time of an application or management action. In California, county agricultural commissioners can request spray records that include wind speed and direction, temperature, and relative humidity at the time of application, which maps directly to the data your weather station already collects [8].
The EPA Worker Protection Standard requires handlers to check wind speed and direction before pesticide applications and to keep records for at least two years [2]. A time-stamped digital weather log sitting on the same system as your spray records is far easier to defend in an inspection than reconstructing conditions from a regional station after the fact.
This is where field software like VitiScribe earns its place: you pull logged ETo and weather conditions straight into spray and irrigation entries instead of transcribing from a separate dashboard. Even a spreadsheet works, though. The habit that matters is exporting station data at the same frequency you log field actions, so both records carry matching timestamps.
One practical note. If you submit to a sustainable winegrowing program (LODI RULES, the California Sustainable Winegrowing Alliance, or VINEA in the Pacific Northwest), most require documented irrigation triggers and water use records. A weather station with automated ETo logging is the cleanest way to produce that documentation without extra paperwork [11].
What are the common mistakes people make when setting up vineyard weather stations?
The biggest mistake is siting the station somewhere convenient instead of somewhere representative. A station next to the shop, under a big tree, or on a hilltop that reflects none of your actual blocks produces data that looks plausible and drives wrong irrigation calls.
Second: buying a station without cellular connectivity, then not downloading data by hand often enough during peak season. You will not walk out to that logger every day in July. If the data has to reach you on its own, get cellular telemetry.
Third: skipping calibration checks. Sensors drift. A pyranometer in its second or third year with a dusty dome can read 10 to 15 percent low, which makes you underestimate ETo and underwater your vines all season. Check the dome monthly during the growing season and compare your station's ETo to the nearest CIMIS or AgWeatherNet station quarterly to catch large drift [3].
Fourth: trusting weather station data alone with no soil sensors to check it. ETo calculations assume average conditions in the root zone. A block with noticeably sandier soil than your station's site will dry out faster than the ET budget predicts. Soil sensors catch that.
Fifth: forgetting the 2-meter wind speed requirement. If your anemometer sits at 3 meters, apply the logarithmic correction factor from FAO-56 before feeding wind speed into Penman-Monteith, or your ETo runs consistently high [4].
How do regional weather networks like CIMIS and AgWeatherNet compare to an on-farm station?
California's CIMIS network (California Irrigation Management Information System, run by the Department of Water Resources) maintains roughly 145 stations statewide and gives you free, publicly accessible ETo data in near real-time [3]. Washington's AgWeatherNet, operated by WSU, covers the major wine regions of Eastern Washington with similar hourly data [10]. Both follow FAO-56 standards and are genuinely reliable references.
The limitation isn't accuracy at the station itself. It's representativeness. A CIMIS station in Lodi may sit 8 miles from your San Joaquin County block. If you're in a valley with afternoon wind channeling, at a different elevation, or on a slope with its own radiation budget, the station's ETo can diverge from yours by 10 to 20 percent on any given day, and that error stacks up over a season.
The practical call from UC Cooperative Extension is to use regional network data as a baseline and for calibrating your on-farm station, not as a replacement [1]. Cross-check your station's ETo against the nearest CIMIS or AgWeatherNet node a few times a season. Agreement within 10 percent on a weekly average means your sensors are probably clean and properly sited. A wider gap is worth investigating: real microclimate, or a sensor problem?
For operations short on capital, a hybrid approach works. Sign up for free CIMIS or AgWeatherNet email alerts for your region, install a low-cost temperature and humidity logger on-farm, and use the two together to build a local correction factor for ETo. It's not ideal. It beats using regional data with no local anchor at all.
What data should your weather station log, and how often?
FAO-56 Penman-Monteith works best with hourly data averaged to daily totals, but logging every 15 minutes gives you finer resolution for frost alerts and redundancy if a reading looks off [4]. Storage is cheap. Log at 15-minute intervals and let the software roll it up to hourly and daily.
Minimum data fields to record:
- Date and time (with UTC offset noted)
- Air temperature (°C), minimum and maximum per hour
- Relative humidity (%)
- Wind speed (m/s at 2 m height)
- Wind direction (degrees)
- Solar radiation (MJ/m² or W/m²)
- Rainfall (mm, tipping bucket count)
Optional fields: leaf wetness (binary or hours wet per period), barometric pressure, and soil temperature at 10 cm depth if you track soil thermal conditions for phenology models.
Most modern dataloggers and cloud platforms (Campbell's LoggerNet, Davis WeatherLink, Onset HOBOlink) calculate ETo automatically from raw sensor inputs once you confirm the Penman-Monteith algorithm is selected and the station height parameters are entered right. Verify this at setup by running a manual calculation from one day's raw data and comparing it to the software output. It sounds tedious. It takes about 20 minutes and catches configuration errors before they run all season.
Back up your data off-device. A lightning strike, a logger failure, or an animal chewing through a cable can wipe months of records. If your station has cloud sync, that's your backup. If it doesn't, set a calendar reminder to export and save the file to a second location every two weeks during the growing season. Spray records and irrigation logs tied to that weather data are legal documents in most states, and gaps in the weather record are gaps in your defense.
How do you use weather station data to set irrigation thresholds in practice?
The goal is a simple, repeatable decision rule you can follow while you're also managing a harvest crew. A practical threshold-based approach looks like this:
- Calculate cumulative ETc for the week (daily ETo x Kc, summed, minus effective rainfall).
- Check soil moisture sensors at 30 and 60 cm. If the 30-cm sensor shows the block has used more than 50 percent of plant-available water (PAW), flag it for irrigation.
- Cross-check against stem water potential readings if you own a pressure chamber. UC guidelines suggest pre-dawn water potential targets for deficit irrigation in wine grapes of roughly -0.2 to -0.4 MPa before veraison, tightening to -0.3 to -0.5 MPa after veraison depending on style goals [5].
- Run the drip system to replace the calculated ETc deficit, adjusted for your emitter flow rate and spacing.
You don't need all three data streams on day one. Start with ETo from the weather station and one pair of soil sensors per block. Add pressure chamber checks during critical growth stages. Over two or three seasons you'll build a feel for how your soil's sensor readings track vine stress, which makes the decision rule faster and steadier.
Keep a plain log of each irrigation event: date, block, runtime, estimated volume applied, and the ETo and soil moisture readings that triggered the call. That log is worth its weight in front of a certification auditor or when you're troubleshooting a quality issue after harvest. VitiScribe's field record module holds exactly this kind of time-stamped irrigation trigger data next to your spray records, so you're not running parallel systems.
In the Paso Robles area and other hot-climate regions with high summer ETo, daily station monitoring through July and August is non-negotiable. Peak ETo in Paso Robles can top 8 mm per day, and a 3-day data gap during a heat event can hide a 24-plus mm irrigation deficit you won't notice until the vines are visibly stressed.
Frequently asked questions
Can I use a cheap consumer weather station like a Davis Vantage Pro2 for ETo calculations?
Yes, with caveats. The Davis Vantage Pro2 carries every sensor the Penman-Monteith equation needs: temperature, humidity, wind, solar radiation, and rain. The main issue is anemometer height. It ships mounted at the unit rather than at 2 meters, which can underestimate wind speed. Mount the anemometer separately at 2 meters, set the WeatherLink software for Penman-Monteith ETo output, and it produces usable data for most vineyard irrigation.
How do I calibrate my vineyard weather station?
Compare your station's weekly ETo output to the nearest CIMIS (California) or AgWeatherNet (Washington) station. Consistent divergence over 10 percent across a week points to a sensor problem. For the pyranometer, inspect and clean the dome monthly. For temperature and humidity, cross-check with a calibrated handheld meter twice a season. Most manufacturers recommend professional sensor recalibration every two to three years.
What is ETo and how is it different from ETc?
ETo (reference evapotranspiration) is water loss from a standardized reference surface, usually short grass, under current weather. ETc (crop evapotranspiration) is the actual water loss from your specific crop. You convert ETo to ETc by multiplying by a crop coefficient (Kc) that accounts for canopy size, growth stage, and vine architecture. Your weather station measures what drives ETo; the Kc table translates that into vine water demand.
How many weather stations do I need for a 40-acre vineyard?
If the 40 acres are relatively flat and uniform in aspect and soil, one station placed centrally or on the prevailing-wind side is usually enough. If the vineyard has distinct blocks with different aspects, elevations, or soil types, two stations capture the variation better. Most UC and WSU extension guidance suggests one station per distinct microclimate zone rather than one per acreage threshold.
Does my weather station need to meet any regulatory requirements for compliance records?
No federal rule mandates a specific station type for general viticulture. But California county commissioners can request weather data at the time of pesticide applications, and the EPA Worker Protection Standard requires handlers to verify wind speed before applications. A calibrated, time-stamped on-farm station is the most defensible way to produce that documentation. Check your county agricultural commissioner's specific requirements for pesticide record content.
What is the best height for a weather station anemometer in a vineyard?
FAO-56 and WMO standards specify 2 meters above the ground surface. That's non-negotiable if you use the Penman-Monteith equation without a correction factor. If your anemometer sits at a different height, apply a logarithmic wind speed adjustment before the calculation. Getting the mounting height right at installation is far easier than applying corrections later.
How do soil moisture sensors and weather stations work together for irrigation decisions?
The weather station estimates how much water vines theoretically used (ETo x Kc). Soil moisture sensors confirm whether that depletion actually happened in the root zone. You use both. If ETo says 25 mm accumulated deficit but sensors show the soil still at 70 percent plant-available water, the vines are pulling from subsoil reserves and you can delay irrigation. If the sensors confirm depletion, you irrigate.
Can I use CIMIS or AgWeatherNet instead of buying my own station?
For a rough-cut irrigation schedule, yes. CIMIS and AgWeatherNet provide reliable, free, FAO-56-based ETo data. The limitation is distance and microclimate representativeness. If the nearest CIMIS station is more than a few miles away or at a meaningfully different elevation, its ETo can diverge from your site by 10 to 20 percent on individual days. For a high-value wine grape block under deficit irrigation, that error matters.
What crop coefficient (Kc) should I use for wine grapes?
Kc for wine grapes runs about 0.15 to 0.25 at budbreak, climbs to 0.50 to 0.70 from fruit set to veraison, and drops back to 0.40 to 0.55 after veraison. These are generalizations from UC Cooperative Extension research. Your actual Kc depends on canopy size, training system, and whether you run deficit irrigation. Always pair Kc-based estimates with on-site soil moisture data to catch site-specific deviations.
How much does a complete vineyard weather station system cost, including soil sensors?
A mid-range agricultural weather station with cellular telemetry runs $1,500 to $2,500. Add two soil moisture sensors per monitored block at $100 to $300 each, plus installation hardware, and a complete single-block system lands in the $2,000 to $3,500 range. Research-grade systems (Campbell Scientific) push past $4,000 before soil sensors. Consumer stations (Davis) start under $1,000 but often need upgrades for agricultural precision.
When should I start logging weather data relative to the growing season?
Start logging by budbreak at the latest. ETo accumulation and soil moisture dynamics from budbreak through bloom shape vine water status at fruit set more than most growers realize. Ideally, run the station year-round: winter rainfall data feeds your pre-season soil water balance, and fall post-harvest data helps you plan post-harvest deficit irrigation. Continuous logging also builds a multi-year baseline to compare seasons.
Do I need to log weather data for sustainable winegrowing certification?
Most third-party sustainable programs, including LODI RULES, the California Sustainable Winegrowing Alliance, and VINEA (Pacific Northwest), require documented irrigation triggers and volume-applied records. Many specifically ask for evidence that decisions rested on crop water demand data such as ETo or soil moisture readings. A weather station with automated ETo logging and a record of decisions tied to that data satisfies those requirements more cleanly than any alternative.
What is the pyranometer on a weather station and why does it matter?
A pyranometer measures incoming shortwave solar radiation in watts per square meter or MJ per square meter per day. It's often the largest driver of ETo variation on clear days. A station without a pyranometer, substituting estimated radiation from sunshine hours or cloud cover, can produce ETo errors of 15 to 25 percent on variable-cloud days. For precision irrigation decisions, a pyranometer is not optional.
Sources
- UC Agriculture and Natural Resources, UC Cooperative Extension Viticulture Research: Temperature, humidity, and wind speed can vary significantly within short distances in vineyard landscapes, making on-site weather measurement important for accurate ETo calculation.
- U.S. EPA, Worker Protection Standard for Agricultural Pesticides: The EPA Worker Protection Standard requires handlers to check wind speed and direction before pesticide applications and retain records for at least two years.
- California Department of Water Resources, CIMIS Program: CIMIS maintains approximately 145 weather stations statewide providing free, publicly accessible ETo data calculated using the Penman-Monteith equation.
- FAO, Irrigation and Drainage Paper 56 (Crop Evapotranspiration: Guidelines for Computing Crop Water Requirements): The FAO-56 Penman-Monteith method requires air temperature, relative humidity, wind speed at 2 meters, and solar radiation; the anemometer must be placed at exactly 2 meters above ground for the standard calculation.
- UC Cooperative Extension, Irrigation of Winegrapes in California (Williams and Ayars): UC Cooperative Extension published Kc values for deficit-irrigated wine grapes ranging from approximately 0.15 at budbreak to 0.70 at fruit set, and recommends pre-dawn stem water potential targets of -0.2 to -0.4 MPa before veraison.
- Washington State University Extension, Irrigation in the Pacific Northwest: WSU Extension notes that over-irrigation in wine grapes commonly reduces fruit quality and adds input costs that can exceed the hardware cost of proper soil moisture monitoring; WSU also recommends siting sensors at average-performing vines within a block.
- Cornell University College of Agriculture and Life Sciences, Viticulture and Enology Program: Cornell Viticulture and Enology extension recommends installing soil moisture sensors at two depths (30 cm and 60 cm) within the drip emitter zone to capture both surface drying and deeper root-zone moisture status.
- California Department of Pesticide Regulation, Pesticide Use Reporting: California county agricultural commissioners can request spray records that include weather conditions at time of application, including wind speed and direction, temperature, and relative humidity.
- UC Davis Department of Viticulture and Enology: UC Davis Viticulture and Enology publishes region-specific grapevine crop coefficient tables and irrigation scheduling guidance based on local ETo data.
- WSU AgWeatherNet, Washington State University: WSU AgWeatherNet operates agricultural weather stations across Washington wine regions, providing hourly ETo and weather data calibrated to FAO-56 Penman-Monteith standards.
- LODI RULES for Sustainable Winegrowing, Certification Standards: LODI RULES sustainable winegrowing certification requires documented irrigation triggers and evidence that water application decisions are based on crop water demand data such as ETo or soil moisture readings.
Last updated 2026-07-11