How to calculate vineyard crop coefficient by growth stage
TL;DR
- Vineyard crop coefficient (Kc) tells you what fraction of reference evapotranspiration (ETo) your vines actually use at a given growth stage.
- Values run from about 0.15 at budbreak to a peak near 1.15 at full canopy, then fall below 0.50 after harvest.
- Multiply ETo from a CIMIS or AZMET station by the right stage Kc and you get actual vine water use (ETc).
What is crop coefficient and why does it matter for grapevines?
Crop coefficient, written Kc, is a dimensionless number that adjusts reference evapotranspiration (ETo) to reflect how much water a specific crop actually moves from soil through leaves into the air. The equation is almost insultingly simple:
ETc = Kc × ETo
ETc is actual crop evapotranspiration. ETo is the grass-reference evapotranspiration from a nearby weather station. Kc is the coefficient you're solving for or applying. That's the whole thing. The complexity lives inside Kc, because it packs the vine's canopy size, stomatal behavior, and ground cover into one number.
Grapevine Kc swings harder across the season than almost any other irrigated crop. A dormant vine in January is a stick in the ground, so Kc can sit below 0.20. A fully leafed-out vine in late July in Napa or the Yakima Valley pushes Kc above 1.10, sometimes higher when the midrow floor is growing [1]. Miss that number by 0.15 at peak season and you over-irrigate or under-irrigate by 15 percent of ETo every day of that stage. Over a 60-day ripening window with average ETo of 0.25 inches per day, that's 2.25 inches of misapplied water. Real money, real quality risk.
Managers in California, Washington, and Oregon need this math locked down for reasons beyond scheduling. Water district reporting and sustainability certifications both want documented ETc estimates. You need the numbers, not a feel.
What are the standard growth stages used for Kc calculations in vineyards?
Grapevine phenology gets split into discrete stages for Kc because canopy development, not the calendar, drives water use. Here are the stages most university extension irrigation models use:
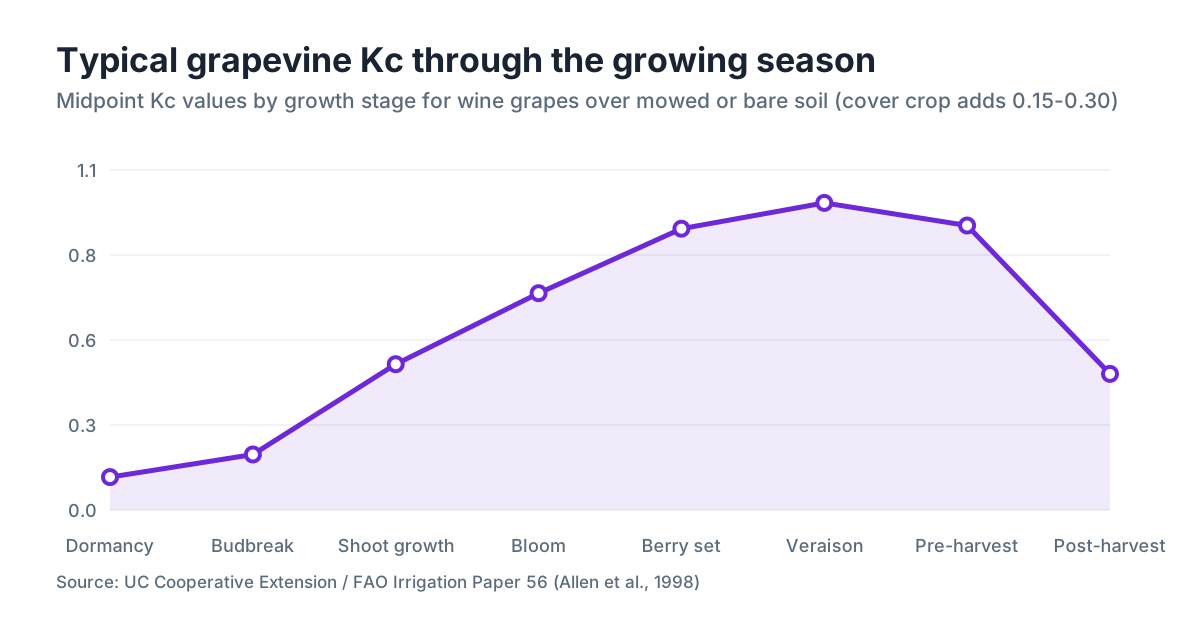
| Growth Stage | Typical Calendar Range (Central Valley, CA) | Kc Range |
|---|---|---|
| Dormancy | Nov, Feb | 0.10 to 0.20 |
| Budbreak | Late Feb, mid-Mar | 0.15 to 0.25 |
| Shoot growth / pre-bloom | Mar, May | 0.25 to 0.70 |
| Bloom | Late May, early June | 0.65 to 0.80 |
| Berry set to veraison | June, late July | 0.80 to 1.10 |
| Veraison to harvest | Late July, Sept | 0.85 to 1.15 |
| Post-harvest | Sept, Nov | 0.40 to 0.55 |
These ranges come from UC Davis and USDA research done mostly in California's Central Valley and coastal regions [1][2]. Farm in eastern Washington or the Columbia Gorge and WSU Extension's irrigation guides use the same stage structure, but they shift the calendar dates two to three weeks later and sometimes compress the bloom window [3].
Here's what the tables don't tell you: these stage boundaries are fuzzy in the field. Bloom doesn't flip on a single day across a block. Plan for a transition band of about a week when the canopy shifts between stages, and average the two adjacent Kc values instead of jumping hard from one to the next. That smoothing keeps your weekly water budget stable.
How do you get ETo data for your vineyard site?
You can't calculate ETc without ETo, and ETo quality depends entirely on how close and how well-maintained your reference weather station is. Three practical sources cover most growers.
California's CIMIS network (California Irrigation Management Information System) runs over 145 active stations, and you can pull daily ETo in inches or millimeters from the CIMIS website for free [4]. If your nearest station is within about 10 miles and sits at a similar elevation, the data is good enough to use straight. If it's 30 miles away across a ridge, apply a terrain correction or budget for a private on-site station.
Washington and Oregon growers use AgWeatherNet (WSU) or the AZMET network (University of Arizona, handy for southern Oregon and California desert AVAs). Both calculate Penman-Monteith ETo using the same FAO-56 method CIMIS uses [11][5]. The FAO-56 Penman-Monteith equation is the international standard:
ETo = [0.408Δ(Rn - G) + γ(900/(T+273))u₂(es - ea)] / [Δ + γ(1 + 0.34u₂)]
You don't run that formula yourself. Every major agricultural weather network runs it in the background and serves you the daily ETo output. Your job is pulling the right station's number.
Third option: your own Davis or Campbell on-site station with the right sensors (air temp, humidity, solar radiation, wind speed at 2 meters). Then you calculate ETo locally with free software like ITRC's IrriSoft or the FAO ET calculator spreadsheet. For a small operation, the free CIMIS or AgWeatherNet station is accurate enough and costs nothing.
How do you calculate Kc from field measurements rather than lookup tables?
Table values are starting points. If you want Kc specific to your vines, your row spacing, your cover crop, and your training system, you derive it from field measurements. Two methods work in practice.
The rigorous one is the soil water balance method. Install capacitance sensors or neutron probes at two or three depths in the root zone, measure soil water content before and after irrigation events, account for rainfall, and back-calculate ETc. Once you have measured ETc, divide by the ETo from your nearest station on the same days to get an observed Kc. You need a few weeks of clean data per stage for a reliable average. It's worth doing for a large block or a new variety you're learning. It costs time and sensor money.
The faster method uses canopy shading fraction. UC Davis research showed a consistent relationship between the fraction of ground shaded by the canopy at midday and Kc for table and wine grapes [1]. The model:
Kc = Kcb_full × (fraction of shaded ground) + Ke × (fraction of wetted bare soil)
Kcb_full is the full-canopy basal coefficient (about 1.10 to 1.15 for vines with no water stress). Ke is the soil evaporation coefficient that spikes after rain or overhead irrigation and drops between events. This dual-coefficient approach is spelled out in FAO Irrigation and Drainage Paper No. 56, the foundational reference for the whole method [6].
For field use, measure canopy shading by photographing the midrow floor at midday and estimating the shaded fraction, or use a line quantum sensor. A vine shading 60 percent of the midrow floor at peak canopy gives Kc ≈ 0.60 × 1.10 = 0.66 for the basal component, before you add soil evaporation. That's meaningfully lower than the lookup value of 0.90 to 1.10 for that stage, and it's probably more accurate for a vertically trellised, narrowly trained Cabernet block than for a sprawling head-trained Zinfandel.
What Kc values should you use from budbreak through shoot growth?
Budbreak to bloom is where most managers under-irrigate, because the vines look fine and the weather is mild. ETo is low in March and April, so even a moderate Kc doesn't demand much water. But this is when you set up canopy architecture, and shoot growth needs steady water availability.
At budbreak (BBCH 07-09), Kc sits between 0.15 and 0.30. Canopy is essentially zero, so most of the small water demand comes off the soil surface, especially after recent rain. On a dry-farmed block or one with minimal spring irrigation, this is your free period.
Through shoot elongation (BBCH 12-57), Kc rises as leaves unfold. A linear interpolation from 0.25 at early shoot growth to 0.65 at late pre-bloom works for most California AVAs [1]. WSU Extension suggests similar values for Yakima and Walla Walla, but notes that cold spring temperatures often suppress actual ET even while canopy develops, so ETo itself is already damped [3].
Don't fixate on precise Kc in this window. ETo is low enough that rounding to the nearest 0.10 changes your weekly calculation by a fraction of an inch. Your bigger risk is over-irrigating a vine sitting on a large untapped soil reservoir, which then pushes excessive vegetative growth. Monitor soil moisture and err conservative.
How does Kc change during bloom and berry set, and why is this stage tricky?
Bloom is when Kc accelerates toward its peak, and it's also when getting irrigation wrong costs you yield. Kc at bloom typically runs 0.65 to 0.80 for a well-developed canopy [1][2]. Sounds simple. The tricky part is that canopy closure is still happening, so your Kc is moving, not static. Use weekly checks of canopy shading or shoot length as a proxy for where you are in the ramp-up instead of a single fixed number.
Water stress during bloom can reduce berry set and cut yield. Mild stress, meaning predawn vine water potential staying between roughly -0.6 and -0.9 MPa, is generally tolerated and may tighten clusters. Severe stress at bloom (below -1.0 MPa predawn) is linked to poor set in UC Davis viticulture and enology research [2]. For a wine grape variety you're not yet sure about, run Kc at the mid-range lookup value and validate with a pressure chamber on shoot tips two or three times a week.
For berry set through veraison, Kc climbs to its season peak. Full canopy with some midrow cover growing can push Kc to 1.10 or above. Dry or mowed-bare midrow? Knock the soil evaporation component (Ke) down and your effective Kc lands at 0.85 to 0.95 in most cases.
What is the peak Kc for grapevines and when does it occur?
Peak Kc for grapevines hits from late berry set through the weeks just before veraison. That's roughly July in California's Central Valley, mid-July to early August in eastern Washington. It coincides with maximum canopy size and usually maximum daily ETo. The combination puts ETc at its season high.
The literature places peak Kc for non-stressed, full-canopy wine grapes at 1.05 to 1.15 when ground cover is actively growing, and 0.85 to 1.00 for vines over bare or mowed soil [1][6]. Research summarized in UC Cooperative Extension irrigation guidance reports well-irrigated Cabernet Sauvignon Kc values in the Napa Valley ranging from about 0.89 to 1.12 across training systems and row orientations, with east-west rows running slightly higher than north-south at peak season because of interception geometry [1].
A concrete example. If CIMIS Station 2 in Napa reports ETo = 0.28 inches on a July day, and your Cabernet block has Kc = 1.05, then ETc = 0.28 × 1.05 = 0.294 inches that day. Over a week that's about 2.06 inches of water use. To turn that into a drip run time you still need emitter flow rates, vine spacing, and system efficiency, but ETc is the target number you work back from.
One thing managers miss: Kc can be depressed on purpose with regulated deficit irrigation (RDI) after berry set. Running the vine below its potential ETc from post-set through veraison is a standard quality tool in premium wine production. Under RDI your applied Kc might be 0.50 to 0.70 instead of 0.90 to 1.10, and that's intentional, not a measurement error.
How should you adjust Kc after veraison and through harvest?
After veraison, the vine shifts from shoot growth to ripening, and in most varieties stomata start closing partway in the afternoon even without stress. That trims actual transpiration relative to a crop at full demand. Post-veraison Kc generally runs 0.85 to 1.05 [1], so it's a modest step down from peak, not a cliff.
For premium red wine, many managers run regulated deficit irrigation from veraison to harvest, targeting midday vine water potential between -1.0 and -1.4 MPa. That intentional stress reduces berry size, concentrates the skin-to-juice ratio, and manages alcohol potential. The effective Kc you apply drops below the crop's potential, sometimes as low as 0.40 to 0.60 in the final three to four weeks before harvest. That's a management decision written into your Kc, not a biophysical constant.
White varieties are different. Many protocols call for less deficit stress post-veraison to protect aromatics and acid. Applied Kc for Chardonnay or Sauvignon Blanc might stay in the 0.70 to 0.90 range through harvest. Build a table that reflects variety, not generic grape.
Post-harvest is where the calculation gets sloppy. The vine still has leaves, still transpires, and still benefits from water to build carbohydrate reserves for next year's budbreak. Post-harvest Kc runs roughly 0.40 to 0.55 until leaf drop [1][2]. Depending on your fall ETo and how long your post-harvest season runs, that adds up to a real irrigation event or two. Don't ignore it.
How do cover crops, row spacing, and training system change your Kc calculation?
The lookup Kc values assume something about your canopy and ground cover. If your vineyard differs from those assumptions, your real Kc differs too.
Cover crops are the biggest variable. Actively growing cereal rye or mustard in the midrow adds 0.15 to 0.30 to your effective Kc at peak cover [6]. That extra demand is real, and it comes from the cover, not the vine, but you're still pumping the water. UC Cooperative Extension advises calculating separate Kc values for the vine and cover crop components, then summing them weighted by the fraction of ground each occupies [1]. If vines shade 50 percent of the ground and cover crops cover 40 percent of the rest, your effective total Kc is roughly:
Kc_total = Kc_vine × 0.50 + Kc_cover × 0.40 + Kc_bare × 0.10
For cover-free, mowed-clean, or dry midrows, Kc drops to the low end of any published range. Most California Kc research was done with minimal active midrow cover, so the lookup tables are often already calibrated for that case.
Row spacing and training height matter because they set canopy volume and leaf area index. A VSP (vertical shoot positioning) system at 6 feet by 10 feet on the Sonoma Coast has a different shading fraction than a Scott Henry at 7 feet by 11 feet in Paso Robles. Taller canopies with more leaf layers per row move more water per unit of ground area. WSU Extension's irrigation model handles this by using row-fraction shading measurements instead of a generic canopy assumption [3].
Tracking several blocks with different training systems, varieties, and cover situations? A simple spreadsheet with one Kc curve per block type is worth building. Tools like VitiScribe can hold your block-level Kc parameters next to your irrigation records, so you're not recalculating from scratch each season.
How do you validate your Kc calculation and know if your model is drifting?
Your best validation tool is probably already in the truck: a pressure chamber. Midday stem water potential on a bagged leaf tells you whether your calculated ETc keeps pace with actual demand. Apply what your Kc model says, watch predawn water potential keep dropping week over week through a stage where you expect it stable, and your Kc is running too low for your conditions.
The benchmarks for balanced irrigation, from UC Cooperative Extension viticulture guidance, are roughly -0.5 to -0.7 MPa predawn for non-stressed vines during shoot growth, and -0.8 to -1.2 MPa for moderately stressed vines during post-set ripening depending on style goals [2]. Cross those thresholds the wrong way over and over and that's your signal the Kc table doesn't fit your block.
Second check: your volumetric flow records. Know how many gallons you applied in a given week, know your emitter spacing and efficiency, and you can back-calculate the ETc you delivered. Compare that to Kc × ETo for the same week. A steady gap over 15 percent points to either a system efficiency problem (clogged emitters, pressure variation) or a Kc miscalibration.
Nobody has strong long-term published data on Kc drift from vine aging or changing training systems in the same block. The closest work is UC Davis research showing Kc increases with vine age and canopy volume through the first 10 to 15 years of vine life, as root-to-shoot ratio and canopy fill change [1]. Recalibrate your Kc assumptions when the vines make a real architectural change: retraining an old head-trained block to VSP, or a switch in cover crop management.
Where do compliance and record-keeping requirements touch your Kc calculations?
Water use reporting keeps growing as a compliance requirement in California and Washington. California's Sustainable Groundwater Management Act (SGMA) requires many agricultural users in overdrafted basins to report consumptive use estimates, and ETc calculated from Kc is the standard method [7]. If your vineyard sits in an area with a Groundwater Sustainability Agency (GSA) requiring annual reporting, your Kc records and the ETo source you used are part of the documentation package.
The EPA Worker Protection Standard (WPS) doesn't address Kc or ETc directly, but it does govern spray timing against wind, temperature, and humidity conditions that any good weather-based irrigation model already tracks [8]. Pull daily CIMIS data for scheduling and you already hold the meteorological record that supports WPS spray timing documentation.
California's Irrigated Lands Regulatory Program (ILRP), run by the Regional Water Quality Control Boards, requires many growers to submit Farm Water Quality Management Plans. Those plans often need to show irrigation amounts tied to crop demand estimates rather than arbitrary schedules, and ETc from Kc is the accepted method [7].
Keep your Kc stage breakdowns, the ETo source station, and the weekly calculated ETc values in one record and you have the documentation backbone for all of these programs with no extra work. A spreadsheet does the job. VitiScribe's field record module logs exactly this next to your spray records and block notes, so the irrigation data lives in the same searchable system as the rest of your compliance paperwork.
What resources and references should you use to build your vineyard Kc curves?
Start with the primary sources, not third-party summaries. The summaries drop the caveats about cover crop conditions and training assumptions that make the numbers mean anything.
The foundational reference for the Kc method and the dual-coefficient approach is FAO Irrigation and Drainage Paper No. 56, "Crop Evapotranspiration: Guidelines for Computing Crop Water Requirements," by Allen et al. (1998) [6]. It's a free download from FAO's website. Chapter 9 covers perennial crops including grapes.
For California-specific values calibrated to real vineyards, UC Cooperative Extension and the UC Davis Department of Land, Air and Water Resources publish grapevine ET work that is the standard reference for CIMIS-based irrigation scheduling [1]. UC Cooperative Extension also runs online viticulture resources and county farm advisor publications that translate the research into practical tables [2].
For Washington State, WSU Extension's Irrigation in the Pacific Northwest publications and the AgWeatherNet platform give you state-specific guidance and station data [3][11]. Pacific Northwest Extension cooperative publications shared among Washington, Oregon, and Idaho are worth downloading if you farm those states.
The American Society of Civil Engineers (ASCE) publishes Manual 70, Evapotranspiration and Irrigation Water Requirements, which covers the engineering side of putting Kc to work at the irrigation system level [10]. It's more technical than most managers need, but if you're sizing a new drip system or chasing a distribution uniformity problem, it's the right place to look.
Your county farm advisor is a genuinely underused resource for local Kc calibration. UC Cooperative Extension farm advisors in Napa, Sonoma, San Luis Obispo, and many other California counties have run local ET trials and hold regionally published tables calibrated to local microclimates far better than any national reference.
Frequently asked questions
What is a typical Kc value for grapevines at full canopy?
At full canopy with an actively growing cover crop in the midrow, Kc typically runs 1.05 to 1.15. For vines over bare or mowed soil, it's 0.85 to 1.00. These values come from UC Davis and FAO research. Your training system and row spacing can push the number higher or lower by 0.10 to 0.15 relative to these midpoints.
How do I calculate actual vine water use (ETc) from ETo?
The equation is ETc = Kc × ETo. Grab the daily ETo from your nearest CIMIS (California), AgWeatherNet (Washington), or AZMET station, then multiply by the Kc for your current growth stage. The result is the water your vines actually use that day. Sum daily values across a week for your weekly irrigation target, then adjust for rainfall and system efficiency.
Can I use the same Kc table for every grape variety?
Not precisely. Published tables are reasonable averages, but variety matters in specific windows. Thick-skinned reds often tolerate more post-veraison deficit, so you apply a lower effective Kc by design. Aromatic whites are often kept better-irrigated post-veraison to protect acid and aroma. Vigor differences between Cabernet Sauvignon and Grenache on the same rootstock also mean real differences in peak Kc. Use variety-specific guidance from your farm advisor when you have it.
How does regulated deficit irrigation (RDI) affect my Kc calculations?
RDI means you intentionally apply less water than ETc demands, so your applied Kc drops below the crop's potential Kc. A common post-veraison RDI target in premium red wine applies water at 40 to 60 percent of ETc, meaning an effective applied Kc of 0.40 to 0.60 even though the vine's full-canopy potential Kc is 0.85 to 1.05. Track both: potential Kc tells you the vine's demand, applied Kc tells you your management decision.
What is the Kc for grapevines during dormancy?
During full dormancy, Kc sits between 0.10 and 0.20. The tiny water loss that does occur is almost all soil evaporation, not vine transpiration, since leaves are gone. In regions with wet winters and no irrigation, this stage is irrelevant to scheduling. In warmer, drier desert AVAs like Paso Robles or southern Arizona, a dormant-period irrigation event may still be needed to recharge the root zone before budbreak.
How do cover crops change the vineyard Kc and should I account for them separately?
Yes, account for them separately. An actively growing cereal or legume cover in the midrow adds 0.15 to 0.30 to your effective Kc at peak cover. FAO Paper 56 recommends a dual-source approach: calculate vine Kc and cover crop Kc independently, weight each by its fraction of ground covered, and sum them. Ignoring cover crop water use is one of the most common reasons growers think their model is underpredicting vine demand.
Which weather network should I use for ETo data in California vs. Washington?
In California, use CIMIS (California Irrigation Management Information System), which runs 145-plus stations and provides free daily Penman-Monteith ETo at cimis.water.ca.gov. In Washington, use WSU's AgWeatherNet at weather.wsu.edu. Both use the FAO-56 Penman-Monteith method, so Kc values from UC Davis or WSU Extension publications apply directly to the ETo they produce.
How do I validate my Kc model is accurate for my specific block?
The pressure chamber is your best validation tool. If predawn stem water potential stays outside your target range despite applying the calculated ETc, your Kc is probably off. Cross-check by comparing applied gallons per week (from your flow meter) to calculated ETc for the same period. A gap larger than 15 percent consistently in one direction points to either a Kc calibration issue or a system efficiency problem like clogged emitters or pressure variation.
Does vine age affect the Kc I should use?
Yes. Young vines in years one through four have much smaller canopies and much lower Kc, often 0.20 to 0.45 at what would be peak-canopy time for mature vines. UC Davis research shows Kc increases with vine age and canopy fill through the first 10 to 15 years. Use age-specific or shading-fraction-based Kc estimates for young vines instead of the mature vine table, or you'll badly over-irrigate.
How often should I recalculate or update my Kc during the growing season?
Update your Kc at each major phenological stage transition, roughly every three to five weeks during active growth. Between transitions, linear interpolation across the stage is accurate enough for weekly scheduling. If something removes canopy, like frost damage, a hailstorm, or aggressive hedging, update your Kc right away, because canopy loss directly cuts the transpiration component.
Is there compliance documentation I need to keep for Kc-based irrigation records?
California SGMA groundwater reporting, the Irrigated Lands Regulatory Program (ILRP), and many water district permits require consumptive use estimates, and ETc from Kc is the accepted method. Keep records of the ETo station you used, the Kc values applied by stage, and the resulting ETc totals by block and week. Most Regional Water Quality Control Boards accept this methodology for Farm Water Quality Management Plan documentation.
What does FAO Paper 56 say about grapevine Kc values?
FAO Irrigation and Drainage Paper No. 56 (Allen et al., 1998) lists mid-season Kc for grapes at about 0.85 for table and raisin grapes under standard conditions, and notes that cover crops and full canopy can push values to 1.10 or higher. The paper also gives the dual-coefficient framework (Kcb + Ke) that separates vine transpiration from soil evaporation, the more precise method for actual scheduling.
Can I build a Kc curve for my vineyard without soil moisture sensors?
Yes, using canopy shading fraction as a proxy. Photograph the midrow floor at solar noon on a clear day, estimate the shaded fraction, then apply Kc ≈ Kcb_full × shaded fraction plus a soil evaporation term. This approach is documented in UC Davis research and gives you a site-specific Kc without sensors. A pressure chamber adds the validation check that sensors would otherwise provide.
How does row orientation affect Kc in a vineyard?
East-west rows intercept more solar radiation at low sun angles, which raises canopy temperature and ET demand relative to north-south rows of the same vine size. UC Davis research in Napa Valley found Kc differences of 5 to 10 percent between orientations at peak season. Worth accounting for if you irrigate east-west and north-south blocks from the same Kc table, but it's secondary to canopy size and cover crop effects.
Sources
- UC Cooperative Extension, Irrigation of Grapevines, Publication 21635: UC Davis and UC Cooperative Extension Kc values for grapevines by growth stage, canopy shading fraction relationships, vine age effects, and row orientation effects on Kc
- UC Davis Department of Viticulture and Enology, Vineyard Water Use and Irrigation: Midday and predawn stem water potential benchmarks for balanced irrigation and the relationship between water stress timing and berry set in wine grapes
- Washington State University Extension, Irrigation in the Pacific Northwest: WSU Extension Kc values and phenological calendar for wine grapes in eastern Washington and the Columbia Gorge region
- California Department of Water Resources, CIMIS (California Irrigation Management Information System): CIMIS provides free daily Penman-Monteith ETo from over 145 active stations across California
- University of Arizona AZMET, Arizona Meteorological Network: AZMET calculates FAO-56 Penman-Monteith ETo for stations in Arizona, useful for desert-adjacent California and southern Oregon AVAs
- FAO, Irrigation and Drainage Paper No. 56 (Allen et al., 1998), Crop Evapotranspiration: Guidelines for Computing Crop Water Requirements: FAO Paper 56 lists mid-season Kc for grapes at approximately 0.85 under standard conditions, provides the dual-coefficient framework separating basal Kc from soil evaporation, and documents the Penman-Monteith ETo equation as the international standard
- California Department of Water Resources, Sustainable Groundwater Management Act (SGMA): SGMA requires agricultural water users in many overdrafted basins to report consumptive use estimates; ETc calculated from Kc is the standard accepted methodology, and Irrigated Lands programs accept the same method
- U.S. EPA, Worker Protection Standard for Agricultural Pesticides (40 CFR Part 170): EPA Worker Protection Standard governs spray timing relative to meteorological conditions including wind, temperature, and humidity
- ASCE, Manual 70 (Jensen et al.), Evapotranspiration and Irrigation Water Requirements: ASCE Manual 70 covers the engineering implementation of Kc and ETc for designing and evaluating irrigation systems for perennial crops including grapes
- WSU AgWeatherNet, Washington State University agricultural weather network: WSU AgWeatherNet provides free daily FAO-56 Penman-Monteith ETo for Washington State stations used in wine grape irrigation scheduling
Last updated 2026-07-11