How to calculate and record carbon footprint of vineyard spray operations
TL;DR
- Vineyard spray operations produce carbon from three sources: diesel burned by tractors and sprayers, nitrous oxide from nitrogen applied in tank mixes, and upstream pesticide manufacturing.
- To calculate your footprint, multiply each fuel or input quantity by its EPA or IPCC emission factor, sum the results in CO₂-equivalent, and log every application with gallons, acres, and equipment hours.
Why does the carbon footprint of spray operations matter to vineyard managers?
Buyers and certification bodies are asking for it. Retailers in the UK, Germany, and increasingly the US now want product-level carbon footprints from suppliers under frameworks like the Wine & Spirit Trade Association's sustainability reporting guidance. California's SB 253, the Climate Corporate Data Accountability Act signed in 2023, pulls large food-and-beverage companies into mandatory Scope 3 reporting, and that pressure runs downstream to the growers who supply them [1].
There's also money in it. USDA's Inflation Reduction Act conservation programs, specifically EQIP and the Climate-Smart Commodities grants, pay growers partly on documented emission reductions [2]. You can't claim a reduction without a baseline, and a baseline needs actual records.
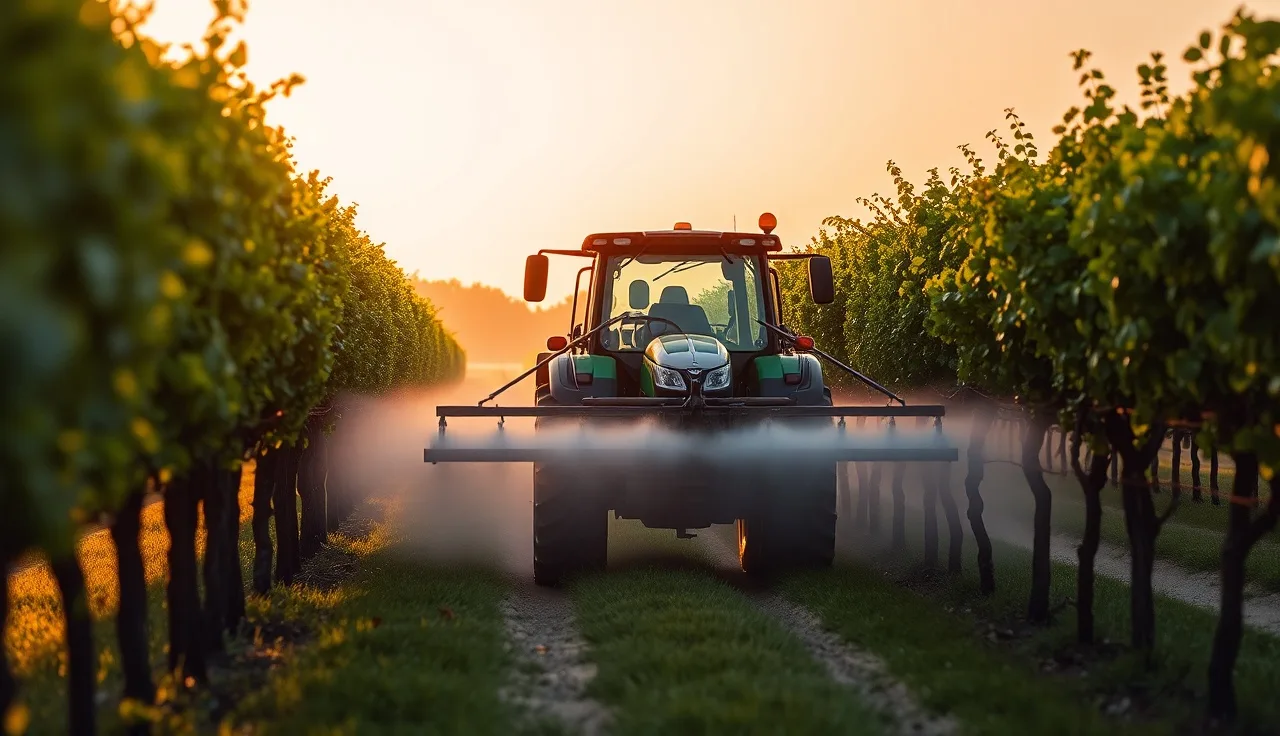
Spray programs are worth isolating because they burn more fuel than almost any other field job. A single season in a cool, disease-prone region like the Finger Lakes or the Willamette Valley can mean 12 to 20 tractor passes per acre. Each pass burns diesel, drives a pump or fan, and sometimes lays down nitrogen-containing tank mixes that feed soil nitrous oxide later. The numbers add up faster than most managers expect.
What emission sources should a vineyard include in its spray carbon calculation?
Spray emissions fall into three scopes under the Greenhouse Gas Protocol, the accounting framework most ag certification programs reference [3]. Scope 1 is what you burn directly. Scope 2 is purchased electricity. Scope 3 is everything upstream, mainly the pesticides and fertilizers someone else made for you.
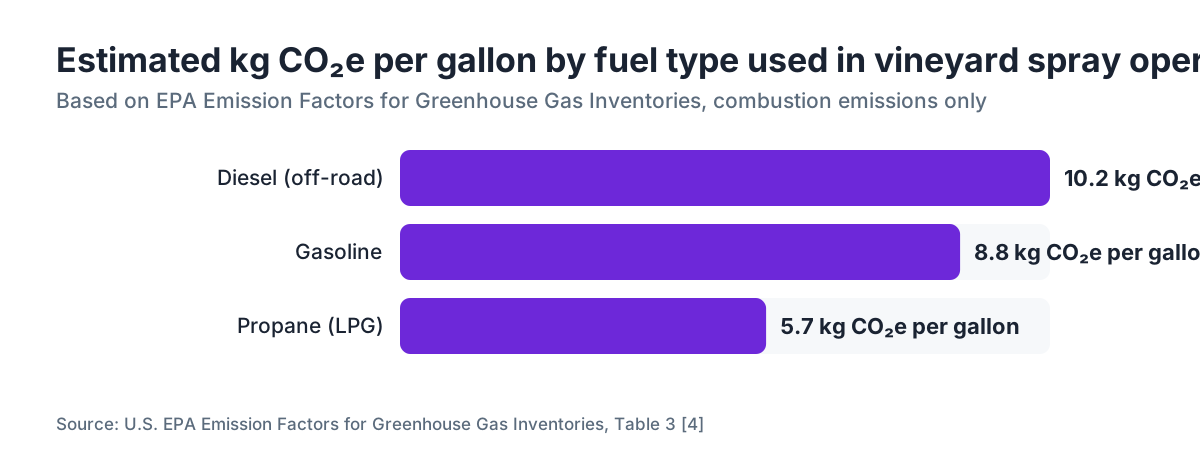
Scope 1 covers direct emissions your operation controls. For spray programs, that's diesel or gasoline burned by the tractor or self-propelled sprayer, plus any propane in frost-protection gear running at the same time. EPA's factor for on-road diesel is 10.21 kg CO₂e per gallon. Off-road diesel (what tractors burn) uses the same combustion chemistry, and EPA's Emission Factors for Greenhouse Gas Inventories table (Table 3) lists 10.19 kg CO₂e per gallon for distillate fuel oil, close enough for farm reporting [4].
Scope 2 covers purchased electricity. Running an electric sprayer or charging battery equipment from the grid means multiplying kilowatt-hours by your regional grid factor from EPA's eGRID database.
Scope 3 covers upstream supply-chain emissions, mostly the production and transport of pesticides and fertilizers. These are hard to pin down because they change with product chemistry and manufacturer. UC Davis's Agricultural Sustainability Institute has published life-cycle energy data for common viticulture inputs [5]. Here's the honest part: most small operations report Scope 1 only and flag Scope 3 as estimated or excluded. That's acceptable under GHG Protocol's agricultural guidance as long as you say so plainly.
One source almost everyone misses. Nitrous oxide off-gasses from nitrogen-containing spray adjuvants or fertigation blended into tank loads. N₂O has a global warming potential 265 times CO₂ over 100 years on the AR5 basis, so even small nitrogen inputs can produce a measurable number through denitrification. IPCC's Tier 1 method uses 0.01 kg N₂O-N per kg of nitrogen applied [6]. Spray foliar urea at any point in your program and that quantity has to enter your math.
What are the actual emission factors you need for the calculation?
Here's the core reference table. Every factor comes from EPA or IPCC.
| Input | Unit | kg CO₂e per unit | Source |
|---|---|---|---|
| Diesel fuel (off-road) | gallon | 10.19 | EPA Table 3 [4] |
| Gasoline | gallon | 8.78 | EPA Table 3 [4] |
| Propane (LPG) | gallon | 5.74 | EPA Table 3 [4] |
| Grid electricity (US avg) | kWh | 0.386 | EPA eGRID 2022 [7] |
| Nitrogen fertilizer (as N) | kg N | 3.63 (production) + N₂O from soil | USDA ERS [8] |
| Nitrous oxide (N₂O) from N inputs | kg N applied | 0.01 kg N₂O-N × 44/28 × 265 | IPCC 2019 Refinement [6] |
A worked example. Your 60-horsepower tractor runs an air-blast sprayer for 3 hours per acre across 10 acres. At about 2.5 gallons per hour under load, that's 75 gallons of diesel. Multiply by 10.19 and you get 764 kg CO₂e, roughly 0.76 metric tons, for that one event [4].
Run that 15 times in a season and tractor fuel alone lands near 11.4 metric tons CO₂e, before you touch pesticide manufacturing or nitrogen. A 20-acre vineyard on a typical California disease program falls somewhere between 8 and 20 metric tons CO₂e per year from spray operations. Nobody has published a tightly controlled study of that exact figure. The range comes from extrapolating UC Davis viticulture energy benchmarks and applying EPA's diesel factor [5].
How do you actually run the calculation, step by step?
Start with your spray records. You need application date, field block, acres treated, equipment used, gallons of water applied (to estimate pump run time if you lack a fuel meter), and any fertilizer or nitrogen adjuvant in the tank.
Step two: get actual fuel data if you can. The cleanest approach is a fuel flow meter on the tractor. No meter? Use the ASABE (American Society of Agricultural and Biological Engineers) Standard D497 fuel consumption model, which estimates diesel use from PTO horsepower and load factor. Cornell Cooperative Extension's agricultural engineering resources explain this in the context of New York farm energy audits [9].
Step three: multiply each fuel quantity by the EPA factor from the table above. Add line items for propane or electricity. That's your Scope 1 and 2 subtotal in kg CO₂e.
Step four: account for nitrogen. If you applied any (foliar urea, liquid feed, or compost teas blended into spray water), take total kg of nitrogen, multiply by 0.01 (the IPCC Tier 1 factor for direct soil N₂O), then multiply by 44/28 to convert to kg N₂O, then by 265 to reach kg CO₂e [6].
Step five: sum everything and express it per acre, per ton of grapes, or per bottle. Per ton of fruit is the most useful for buyer-facing reports because it normalizes across vintage size.
Step six: record it. Write the total CO₂e next to your spray log entry, or keep a separate carbon log that cross-references spray dates and block IDs. Washington State University Extension's farm recordkeeping guidance recommends treating carbon records on the same retention schedule as pesticide application records, usually five to seven years depending on state law [10].
Tools like VitiScribe can attach calculated emission fields straight to digital spray records, which kills the cross-referencing step and keeps compliance data in one place.
What format should vineyard spray carbon records be in?
There's no single federal format for voluntary ag carbon records. But if you're working toward California Air Resources Board reporting, a Verified Carbon Standard audit, or USDA EQIP documentation, each has its own minimum fields. Include these no matter which framework you target.
Required at minimum:
- Date of application
- Field block identifier and acres treated
- Equipment ID and type (tractor horsepower, sprayer model)
- Fuel type and quantity (gallons consumed or estimated)
- Any nitrogen inputs by weight and N content
- Calculated emission per application event in kg CO₂e
- Running season total per block
- Calculation method noted (for example, "EPA Table 3, off-road diesel, 10.19 kg CO₂e/gal")
The methodology note is the field everyone skips. Then two years later an auditor asks how you got your number and there's no answer. Write it down. One sentence does it.
A spreadsheet works fine for format. A PDF print of a digital spray log satisfies most third-party auditors. USDA program portals accept CSV or PDF attachments alongside conservation practice documentation [2].
Retention: EPA's Worker Protection Standard requires pesticide application records for two years [11]. California requires three years for restricted-use pesticide records. Carbon records that back a USDA payment claim should live for the contract period plus three years, which can stretch to ten. Store them somewhere you can actually find them.
How does diesel tractor fuel compare to other spray emission sources in magnitude?
Diesel combustion almost always wins, and it isn't close. UC Davis energy benchmark data for North Coast California vineyards puts tractor fuel at roughly 60 to 75 percent of total on-farm energy use, with spray and canopy passes as the main drivers [5]. Pesticide manufacturing (Scope 3) is second when anyone measures it, but the numbers swing hard by product. Copper-based fungicides carry lower manufacturing intensity than synthetics, yet copper often goes on at higher rates per acre, so the net comparison is product-specific.
N₂O from nitrogen inputs is small in absolute terms for most spray programs, because spray-applied N rates sit well below broadcast fertilizer rates. But multiple foliar urea applications at 5 to 10 lbs of actual N per acre make the N₂O contribution real. The 265-times warming potential amplifies even a light nitrogen touch.
Electricity for electric sprayers is the smallest source in nearly every vineyard right now, because electric self-propelled sprayers are still rare. That's shifting. If you're pricing an electric sprayer, use your local eGRID subregion factor, not the national average. The Pacific Northwest grid runs near 0.12 kg CO₂e per kWh while the Midwest sits closer to 0.45 [7].
Can spray timing and technique actually reduce your carbon footprint?
Yes, and the reductions are big enough to measure and claim.
Fewer passes is the blunt tool. Switching from calendar-based schedules to disease-model timing (UC Davis UC IPM models, for instance) can cut spray passes by three to six per season in lighter-pressure years [12]. At roughly 13 kg CO₂e per pass per acre, six fewer passes across 20 acres avoids about 1.6 metric tons CO₂e. That's not nothing.
Variable-rate and sensor-guided sprayers cut product use and shave pump run time, which trims engine load a little. Savings are modest per pass but compound across a season.
Electric or hybrid sprayers wipe out Scope 1 combustion from the sprayer drive, though the tractor PTO still burns diesel unless you're on a fully electric tractor. Those stay expensive and range-limited for larger properties.
Shorter rows cut turning time. Sounds minor. A 2017 study in the Journal of Cleaner Production on European vineyard mechanization found that headland turns in narrow-row vineyards can eat 15 to 20 percent of total tractor fuel per operation. Tighter turns, shorter headlands, smarter route patterns, all of it shows up in the fuel log.
Record the changes. Cut spray passes from 16 to 11 and you document both the old baseline and the new number, plus the reason ("switched to Leaf Wetness Index model on May 15"). That paper trail is what justifies a reduction claim to a certifier or a buyer.
What do university extension programs say about vineyard carbon accounting?
UC Davis, Cornell, and WSU have all published farm carbon footprinting guidance, though none has a single spray-specific calculator that handles all three emission sources as of 2025. Start with energy accounting before you reach for full lifecycle assessment, because fuel and electricity data is far easier to gather cleanly.
UC Davis's Agricultural Sustainability Institute publishes energy-use benchmarks for North Coast and Central Coast viticulture, the most credible regional baseline for California growers [5]. Their advice is to nail energy accounting first.
Cornell Cooperative Extension's agricultural energy audit toolkit includes tractor fuel estimation worksheets built on ASABE standards. It's aimed at New York growers, but the method transfers to any region [9]. Cornell also runs the PRO-DAIRY carbon accounting program for dairies, and some of that methodology translates to specialty crops.
WSU Extension has published a series on sustainable winegrowing tied to the Washington Sustainable Winegrowers program, including a carbon footprinting module that references the Cool Farm Tool, a peer-reviewed web calculator developed by Unilever and the University of Aberdeen [10]. The Cool Farm Tool handles soil N₂O from nitrogen inputs using IPCC Tier 1 factors and is free. It's the closest thing to a vetted, spray-aware carbon calculator a small vineyard can grab today.
The honest limit: none of these is fully automated. You still enter your own spray records, fuel receipts, and nitrogen data. Output quality tracks record quality exactly.
How do you integrate spray carbon records with existing pesticide application records?
Add two columns to whatever spray log you already keep: "Fuel used (gal)" and "Emission this application (kg CO₂e)." On paper, that's two ruled columns. In a spreadsheet, two formula cells.
The pesticide application record you already keep under EPA's Worker Protection Standard (40 CFR Part 170) captures date, location, product, rate, and applicator name [11]. California DPR and most state ag departments add acres treated and equipment type. That's nearly everything a carbon calculation needs, except fuel quantity. Add fuel and you've got one record that does compliance and carbon at once.
For operations on digital spray records in platforms like VitiScribe, the carbon math can run automatically once you set each machine's fuel consumption profile, and the results attach to the same record that satisfies WPS and state pesticide reporting. That's genuinely useful because it ends the double-entry problem that makes carbon accounting feel like busywork.
One practical trick: photograph your fuel tank gauge or flow-meter display before and after each spray day. Five seconds. That time-stamped phone photo is audit-ready proof of actual fuel burned instead of an estimate. Auditors want actuals, and so should you.
Are there third-party standards or certifications that recognize vineyard spray carbon records?
Several, though the landscape is still forming. LEED and other building certifications don't apply here. These are the frameworks that actually touch vineyard operations.
VCS (Verified Carbon Standard / Verra): Verra's VM0042 methodology covers improved agricultural land management and can credit emission reductions from lower synthetic inputs and fuel use. It requires third-party verification and a project-level monitoring plan, realistic for grower groups or larger estates, less so for a 15-acre family operation going it alone [3].
USDA COMET-Farm: the USDA's COMET-Farm tool is the official modeling tool for EQIP and RCPP conservation practice carbon payments. It doesn't model spray fuel directly (it focuses on soil carbon and fertilizer N₂O), but your spray records feed the N₂O inputs [2].
Sustainable winegrowing programs: California Sustainable Winegrowing Alliance, Washington Sustainable Winegrowers, and Oregon LIVE all fold carbon or energy metrics into their annual self-assessments. None demands third-party verification of the spray-specific carbon figure, but you need the data to fill the forms out honestly.
Carbon insets (supply-chain credits): some large wine companies now pay growers for documented on-farm emission reductions as part of their own Scope 3 targets. These are bilateral contracts, not certified markets, but they still require documented baselines and monitoring records, which is exactly what a proper spray carbon log gives you.
What's a realistic starting point for a small vineyard with no existing carbon records?
Start with last year's fuel receipts. Buy diesel through a farm account or fleet card and you already have a purchase history. It's not per-application metering, but it gives you an annual total you can split across operations by estimated hours per task.
Next, list every spray event from your pesticide records (you already keep those). Estimate hours per event from spray log notes or memory. Multiply by your tractor's burn rate. ASABE D497 gives you a formula, and roughly 0.044 gallons per hour per horsepower at 75 percent load is a reasonable stand-in for a mid-size vineyard tractor [9]. That produces spray-specific fuel use. Apply the EPA factor. Now you have a baseline.
It won't be perfect. A metered figure beats it. But a documented, transparent estimate is worth infinitely more than nothing, and it gives you something to improve against. Write your assumptions into the record: "Fuel estimated using ASABE D497 at 75% load, 60 HP tractor" is enough.
Year two, add a fuel flow meter. A simple inline diesel meter runs $200 to $600. Your accuracy jumps from ballpark to defensible. That's money well spent against the cost of redoing calculations for an auditor two years out.
For how vineyard field operations tie into recordkeeping requirements more broadly, see our overview of vineyard operations and compliance documentation.
Frequently asked questions
What emission factor should I use for off-road diesel in vineyard tractor operations?
Use 10.19 kg CO₂e per gallon for distillate fuel oil (off-road diesel), from EPA's Emission Factors for Greenhouse Gas Inventories, Table 3. That figure combines CO₂, CH₄, and N₂O from combustion and converts all three to CO₂-equivalent using IPCC AR5 global warming potentials. It's the standard factor for farm equipment in US greenhouse gas inventories.
Do I need to include pesticide manufacturing emissions in my spray carbon footprint?
Usually not for voluntary or program-based reporting. Manufacturing emissions are Scope 3, and the GHG Protocol's agricultural guidance lets small operations exclude Scope 3 categories that aren't material or measurable with available data. Note the exclusion in your records. If you're pursuing a formal LCA or a buyer contract requiring full Scope 3, you'll need product-specific environmental product declarations from your suppliers.
How much CO₂e does one tractor spray pass produce per acre?
A rough benchmark: a 60-HP tractor running an air-blast sprayer for about 0.5 hours per acre at 75 percent load burns roughly 1.3 gallons of diesel. At 10.19 kg CO₂e per gallon, that's about 13 kg CO₂e per acre per pass. Actual numbers shift with tractor size, sprayer type, row spacing, and ground speed. Use your own fuel data whenever you can rather than these approximations.
Does foliar urea in a spray tank contribute to my carbon footprint?
Yes, two ways. First, urea production carries a manufacturing footprint (roughly 1.5 to 2.0 kg CO₂e per kg of urea, Scope 3). Second, nitrogen deposited on and around vines feeds soil N₂O through denitrification. The IPCC Tier 1 factor is 0.01 kg N₂O-N per kg nitrogen applied. At N₂O's GWP of 265, even a 5 lb-per-acre foliar urea application adds a measurable N₂O term to your footprint.
Can I use the Cool Farm Tool for vineyard spray carbon accounting?
Yes. The Cool Farm Tool, developed with the University of Aberdeen and peer-reviewed, handles crop fuel use and nitrogen-driven N₂O with IPCC Tier 1 methods. WSU Extension references it in Washington Sustainable Winegrowers guidance. You input your fuel use and nitrogen applications by hand. It doesn't auto-import spray records, so you still need organized field logs to feed it accurate data.
How long do I need to keep vineyard carbon records?
No federal law sets a retention period specifically for carbon records. EPA's Worker Protection Standard requires pesticide application records for two years; California mandates three years for restricted-use materials. For records supporting a USDA EQIP payment or a carbon inset contract, keep them through the contract period plus at least three years. Practically, keep carbon records as long as your pesticide records and match retention to the longest applicable rule.
What is the GWP of nitrous oxide and why does it matter for spray records?
The IPCC Sixth Assessment Report (AR6, 2021) sets N₂O's 100-year global warming potential at 273 CO₂-equivalents on a GWP100 basis; many frameworks still use 265 from AR5, so check which GWP vintage yours specifies. It matters because any nitrogen applied in or near a spray program feeds soil N₂O, and a small nitrogen input creates a large CO₂e figure once the 265 to 273 multiplier hits it.
Does California's SB 253 require vineyards to report spray-related carbon emissions?
SB 253 targets companies with over $1 billion in annual revenue operating in California, requiring Scope 1, 2, and 3 reporting, with Scope 1 and 2 disclosure phasing in from 2026. Vineyards themselves are almost never the reporting entity. But supply grapes to a large wine company subject to SB 253 and their Scope 3 includes your Scope 1 and 2 emissions. That's why buyers now request grower-level carbon data even though growers don't report directly.
How do I estimate tractor fuel use if I don't have a fuel flow meter?
Use the ASABE Standard D497 approach: estimated diesel use in gallons per hour equals roughly 0.044 multiplied by engine horsepower at 75 percent load for field work. A 60-HP tractor at 75 percent load burns about 2.6 gallons per hour. Multiply by hours per spray event from your log. This method appears in Cornell Cooperative Extension's farm energy audit materials and is acceptable for baseline estimation in most USDA program documentation.
What's the difference between Scope 1, 2, and 3 emissions in a vineyard context?
Scope 1: emissions you produce directly, like diesel burned in your tractor or N₂O from your soil. Scope 2: emissions from purchased electricity you consume. Scope 3: upstream and downstream emissions outside your direct control, like the manufacturing of the pesticides you bought or the transport of your wine to market. For spray operations, most practical reporting focuses on Scope 1 because it's measurable from your own fuel records.
Is there a free calculator tool specifically for vineyard spray carbon footprints?
No purpose-built, spray-specific vineyard tool exists as of 2025. The closest options are USDA's COMET-Farm (free, handles soil N₂O and fertilizer), the Cool Farm Tool (free, crop-level fuel and nitrogen), and UC Davis energy-use spreadsheets for California viticulture. You'll likely combine a fuel-based calculation using EPA emission factors with one of these tools to cover all your spray emission sources.
Can reducing spray passes earn USDA conservation payments?
Indirectly, yes. USDA EQIP Practice 595 (Integrated Pest Management) and several Climate-Smart Commodities project structures reward documented reductions in synthetic pesticide and fuel use. The payment ties to conservation practice adoption and documented acres, not the CO₂e number directly. But the documentation those payments require (fuel records, practice records, before-and-after spray logs) is the same set you'd build for carbon accounting.
How do I report carbon per ton of grapes rather than per acre?
Divide your total seasonal spray CO₂e in kg by your total harvest weight in metric tons. Produce 2.5 tons per acre across 20 acres (50 metric tons) with spray operations generating 8,000 kg CO₂e, and your spray intensity is 160 kg CO₂e per metric ton of fruit. This normalizes across vintages with different yields and is the format most wine-industry sustainability frameworks prefer for product-level reporting.
What records do I need before a third-party carbon audit of my spray program?
Auditors typically want dated pesticide application records with acres and block IDs, fuel receipts or metered fuel logs tied to specific dates, an equipment inventory with horsepower ratings, nitrogen input logs (foliar or fertigation), a calculation worksheet showing emission factors and methodology, and your baseline and monitoring years documented separately. Two to three years of consistent records before you seek certification strengthens your baseline claims a lot.
Sources
- California Legislative Information, SB 253 Climate Corporate Data Accountability Act (2023): California SB 253 requires companies with over $1 billion in revenue operating in California to report Scope 1, 2, and 3 GHG emissions, with Scope 1 and 2 disclosure phasing in from 2026.
- Verra, Verified Carbon Standard VM0042 Methodology: Verra's VCS VM0042 covers improved agricultural land management and can credit emission reductions from reduced synthetic inputs and fuel use with third-party verification.
- U.S. EPA, Emission Factors for Greenhouse Gas Inventories (Table 3, Stationary Combustion): EPA emission factor for distillate fuel oil (off-road diesel) is 10.19 kg CO₂e per gallon; gasoline is 8.78 kg CO₂e per gallon; propane is 5.74 kg CO₂e per gallon.
- UC Davis Agricultural Sustainability Institute: UC Davis energy benchmarks for North Coast California vineyards indicate tractor fuel accounts for roughly 60 to 75 percent of total on-farm energy use, with spray passes as primary drivers.
- IPCC 2019 Refinement to the 2006 IPCC Guidelines, Volume 4 Agriculture, Chapter 11: IPCC Tier 1 emission factor for direct soil N₂O emissions is 0.01 kg N₂O-N per kg of nitrogen applied; N₂O GWP100 is 265 (AR5) to 273 (AR6).
- U.S. EPA, eGRID (Emissions & Generation Resource Integrated Database): US average grid emission factor is approximately 0.386 kg CO₂e per kWh (eGRID 2022); Pacific Northwest subregion is approximately 0.12 kg CO₂e per kWh and the Midwest closer to 0.45.
- USDA Economic Research Service: Production of nitrogen fertilizer carries approximately 3.63 kg CO₂e per kg of nitrogen produced, reflecting energy-intensive Haber-Bosch manufacturing.
- Cornell Cooperative Extension, Agricultural Energy Audit Resources: Cornell Cooperative Extension farm energy audit materials use ASABE Standard D497 fuel consumption models to estimate diesel use from PTO horsepower and load factor.
- Washington State University Extension, Sustainable Winegrowing: WSU Extension references the Cool Farm Tool for carbon footprinting in Washington Sustainable Winegrowers guidance and recommends treating carbon records with the same retention schedule as pesticide records.
- U.S. EPA, Agricultural Worker Protection Standard (40 CFR Part 170): EPA's Worker Protection Standard requires pesticide application records capturing date, location, product, rate, and applicator name, kept for two years.
- UC Davis UC IPM Program, Grape Pest Management Guidelines: UC Davis UC IPM disease models for grapevine can reduce spray passes by three to six per season in years where disease pressure is lower than calendar-based programs assume.
Last updated 2026-07-11