Drip irrigation scheduling based on ETc and crop coefficient
TL;DR
- ETc (crop evapotranspiration) equals reference ET (ETo) multiplied by the crop coefficient (Kc).
- For wine grapes, Kc runs from about 0.15 at budbreak to a peak near 0.70 at full canopy, then drops after veraison.
- Multiply daily ETo by the right Kc, subtract meaningful rainfall, and that number becomes your drip runtime.
- Most vineyards overwater by 20 to 40%.
What is ETc and why does it drive irrigation scheduling?
ETc stands for crop evapotranspiration. It's the water a specific crop loses to the air on a given day, combining soil evaporation and plant transpiration into one number. The formula is short:
ETc = ETo × Kc
ETo is reference evapotranspiration, calculated from weather data (temperature, humidity, wind, solar radiation) as if the field were a well-watered grass surface. Kc is the crop coefficient, a dimensionless number that adjusts ETo for what your actual crop is doing at a specific growth stage [1].
Precision is the reason this matters for drip. A drip system skips the soil buffer that flood or sprinkler systems rely on. You deliver water straight to the root zone in small doses, so you need accurate demand numbers, not calendar guesses. On a hot July day in Paso Robles, ETo might hit 0.38 inches. Multiply by a mid-season Kc of 0.55 and you need to replace about 0.21 inches per vine row. Miss that number all season and you either stress the vine at veraison or push vigor that invites disease.
The method comes from the FAO Irrigation and Drainage Paper No. 56, which set out the dual-crop coefficient approach still used by UC Davis and most western extension programs [1]. Every credible irrigation model in grape production traces back to that document.
How do you get ETo values for your vineyard?
The most reliable ETo source in California is CIMIS, the California Irrigation Management Information System, a network of roughly 145 automated weather stations reporting daily ETo by the Penman-Monteith method [2]. You pull your nearest station's data at no cost. Washington growers use AgWeatherNet from WSU, which works the same way [3]. Oregon uses AgriMet from the Bureau of Reclamation [11]. Most other states tie into NOAA networks or use ASCE standardized Penman-Monteith calculations from regional mesonet stations.
If your vineyard sits in a micro-climate that differs from the nearest station, install your own on-site weather station. Basic CIMIS-compatible stations run $2,000 to $5,000 installed, and the payoff is real data from your hillside instead of an airport five miles away. In coastal and mountain sites, that gap can reach 15 to 25% on peak ETo days [4].
Want a simpler starting point? The UC Cooperative Extension work on vineyard water use publishes seasonal ETo summaries by county and growing degree zone [4]. Those are monthly averages, not daily values, so they're rougher, but they work as a first-pass check on your seasonal water budget.
One thing to keep in mind: ETo is defined at a hypothetical grass reference surface 12 centimeters tall. Your vineyard floor, especially with a cover crop, behaves differently. The Kc is supposed to account for that, but in practice Kc tables assume a clean vineyard floor. Run a dense midrow cover and you may need to add 0.05 to 0.15 depending on cover crop type and growth [4].
What Kc values should you use for wine grapes at each growth stage?
The crop coefficient for wine grapes moves through the season. It tracks canopy development, then drops on purpose when you want to stress the vine after veraison.
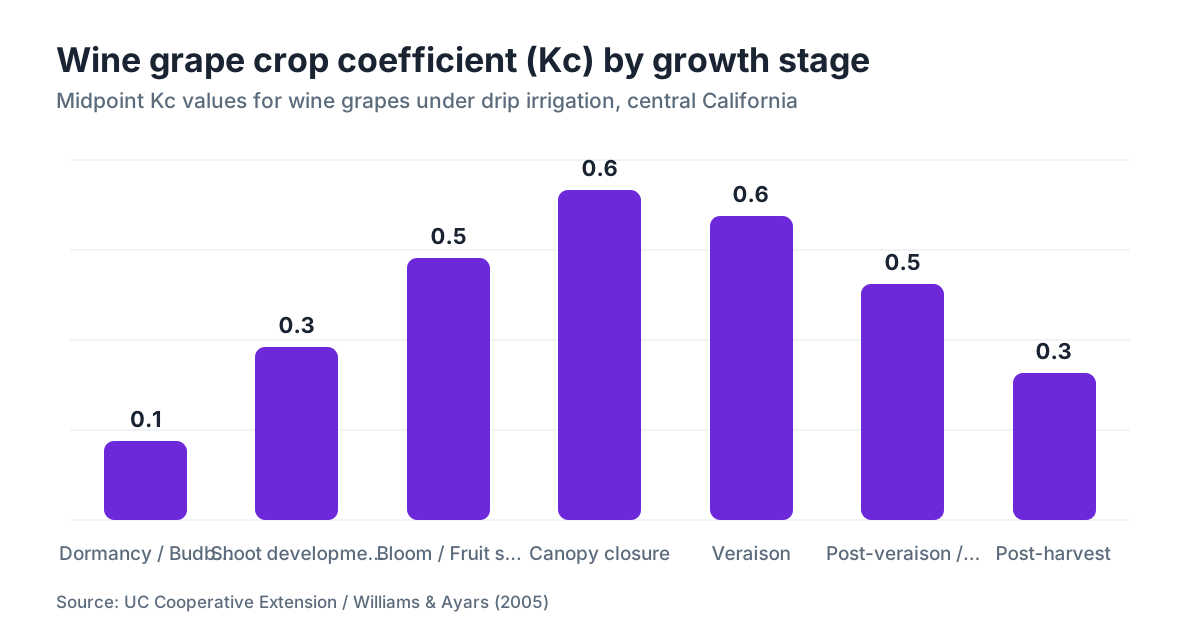
The table below shows the Kc ranges most commonly cited by UC Davis and WSU extension for wine grapes under drip:
| Growth Stage | Approximate Dates (Central Valley) | Kc Range |
|---|---|---|
| Dormancy / Budbreak | Jan, mid-Apr | 0.10 to 0.20 |
| Shoot development | mid-Apr, late May | 0.20 to 0.45 |
| Bloom / Fruit set | late May, mid-Jun | 0.45 to 0.55 |
| Canopy closure (pre-veraison) | mid-Jun, late Jul | 0.55 to 0.70 |
| Veraison | late Jul, mid-Aug | 0.50 to 0.65 |
| Post-veraison / Ripening | mid-Aug, harvest | 0.35 to 0.55 |
| Post-harvest | harvest, leaf fall | 0.20 to 0.35 |
These are ranges, not fixed numbers. Canopy size is the biggest variable. A sprawling, heavily trellised Zinfandel canopy in Lodi carries a much higher Kc at canopy closure than a cordon-pruned, deficit-managed Cabernet in Napa. Williams and Ayars (2005) published canopy-cover-corrected Kc values showing that Kc scales roughly linearly with fractional canopy cover: a vine covering 60% of its row area has about 60% of the Kc of a vine at full cover [5].
So measure your actual canopy cover early in the season, either by photograph from directly overhead or with a simple midday sun-fleck measurement. UC Davis researchers use the fraction of shaded ground at solar noon as a quick proxy for canopy cover [5].
Post-veraison deficit is where wine quality and water savings meet. Most quality-focused programs drop applied water to 40 to 60% of ETc after veraison to moderate berry size and concentrate flavor. This is regulated deficit irrigation (RDI), and WSU has trial data showing it works without a yield penalty when stem water potential is monitored [3].
How do you calculate how long to run your drip system?
Once you have ETc for the day or week, converting it to runtime is straightforward, but you need three facts about your system: emitter flow rate in gallons per hour, emitter spacing, and row spacing.
Here's the math:
- Convert ETc from inches to gallons per vine. One inch of water over one square foot is 0.623 gallons. If your vine spacing is 6 feet within row and 10 feet between rows, each vine covers 60 square feet. So 0.21 inches of ETc × 0.623 × 60 = 7.85 gallons per vine per day.
- Divide by your emitter output. Two 1 GPH emitters per vine deliver 2 GPH. Runtime = 7.85 ÷ 2 = 3.9 hours.
- Adjust for distribution uniformity (DU). A well-maintained system at 90% DU means you run 3.9 ÷ 0.90 = 4.4 hours so the least-watered vine still gets its share.
Don't skip the DU step. A system at 75% DU, common in aging drip with partial clogging, forces you to over-irrigate some vines just to water others. UC Cooperative Extension recommends pressure-checking and DU-testing drip systems every year [4]. A pressure drop of more than 5 PSI from head to tail of a lateral usually signals clogging or a leak that wrecks your scheduling math.
Most growers schedule weekly, not daily. That means summing daily ETc over 7 days, subtracting measured rainfall above 0.10 inches (light rain mostly evaporates and doesn't recharge the root zone), then running one or two events to cover the deficit. Weekly scheduling also gives you room around heat spikes without running the pump controller every day.
How does regulated deficit irrigation (RDI) fit into an ETc-based schedule?
Regulated deficit irrigation is a deliberate departure from full ETc replacement. Instead of targeting 100% ETc, you replace 50 to 70% during set windows, most often from veraison through harvest.
The agronomic case is documented. A UC Davis study found post-veraison RDI at 50% ETc reduced berry weight by 12 to 18% while raising anthocyanin concentration, with no statistically significant difference in final yield per acre under careful monitoring [10]. Monitoring is the catch. You can't drop the replacement fraction and walk away. Stem water potential, measured with a pressure bomb (Scholander chamber) at solar noon on fully shaded leaves, is the feedback signal. Target stem water potential for most Vitis vinifera varieties in the quality deficit range is roughly negative 12 to negative 16 bars during ripening [5].
Drop below negative 18 to negative 20 bars and you're past managed stress into damaging stress. Recovery from severe late-season stress carries into the following year's carbohydrate reserves and weakens next spring's shoot growth.
Pre-bloom is the wrong time for deficit. Water stress at bloom can cause poor fruit set and shatter. Most protocols hold near-full ETc from budbreak through fruit set, shift to 70 to 80% ETc from fruit set to veraison, then run 40 to 60% ETc post-veraison depending on target wine style.
If you want a structured way to track stage-specific replacement targets alongside your ETc numbers, VitiScribe lets you log daily ETo, the active Kc for each block, and stem water potential readings in one place. That makes it easier to catch drift from your targets before it costs you a block.
What tools and technology help automate ETc-based scheduling?
You don't have to run every number by hand. Several tools do the heavy lifting once you set them up right.
CIMIS Online (California only) lets you query daily ETo by station and export it as a CSV. You supply the Kc and the rest is simple math [2]. The USDA Bureau of Reclamation's IrrigationSCHEDULER does similar work for Pacific Northwest growers on AgriMet stations [11].
Soil moisture sensors are the most direct feedback tool and pair well with ETc scheduling. Capacitance sensors (Sentek EnviroSCAN, Campbell CS655) give you continuous volumetric water content at multiple depths. The goal is to irrigate when the soil hits your depletion threshold, usually 30 to 50% of plant-available water for grapevines, and ETc tells you how fast you'll get there in a given week [3].
Satellite-based canopy monitoring, sold by several commercial services, estimates fractional canopy cover from NDVI imagery and can update your Kc mid-season without hand measurements. That helps in large vineyards where block-to-block canopy variation is real. Accuracy depends on image resolution and timing, and nobody has clean data on how these services perform across every grape region. The closest evidence: a 2021 review in Irrigation Science found satellite-derived Kc estimates within 8 to 12% of ground-measured values for tree crops, and comparable accuracy is plausible for trellis-trained vines [6].
Flow meters on your mainline are cheap insurance. A $150 to $400 inline flow meter tells you right away if a zone runs outside expected parameters, which flags leaks, emitter failures, or valve problems that would otherwise quietly ruin your scheduling math.
How do soil type and root zone depth change your ETc scheduling?
ETc tells you how much water the vine demands. Soil tells you how big a reservoir you draw from between irrigations.
Plant-available water (PAW) is the water held between field capacity and permanent wilting point. Sandy loams hold roughly 0.8 to 1.2 inches of PAW per foot of depth. Clay loams hold 1.5 to 2.0 inches per foot. Your effective rooting depth (typically 2 to 4 feet in established vineyards on well-drained soils) sets your total reservoir.
Here's why that drives scheduling frequency. Say your soil holds 1.4 inches of PAW per foot and roots reach 3 feet. Your reservoir is 4.2 inches. On a midsummer day with ETc of 0.22 inches, you have 19 days of water before wilting point in theory. In practice you irrigate before 50% depletion, so your real interval is about 9 days. Move to a clay-heavy soil at 1.8 inches per foot and the interval stretches to 12 days, meaning less frequent, longer events.
Sand is the problem case. At 0.7 inches of PAW per foot and a 2-foot root zone, you store 1.4 inches, and at 50% depletion you irrigate every 3 days. Drip in sandy soil runs near-daily in peak summer. That's fine for the vine but demands perfect system reliability.
Texture-by-feel testing is serviceable for estimating a PAW class. A proper soil texture lab analysis from your county extension costs $20 to $50 per sample and gives you actual field capacity and wilting point values. Two or three samples per major soil series in your blocks is all you need.
How do you account for cover crops and bare soil in your Kc?
Standard Kc tables for wine grapes assume the interrow is bare soil or a sparse, dry cover. That's not reality for most growers running permanent or annual covers for erosion control, beneficial insects, or nutrition.
A living midrow cover adds its own evapotranspiration demand. The FAO dual-crop coefficient framework handles this by splitting Kc into two parts: Kcb (basal crop coefficient, the vine transpiration) and Ke (soil evaporation, or here, cover crop transpiration) [1]. For practical scheduling, most California extension guidance simply adds 0.10 to 0.20 to the vine Kc while the cover crop is actively growing [4].
Dry-farmed or mowed-flat covers don't add much. A mowed residue row has little active transpiration and mostly adds a mulch effect that cuts soil evaporation from the vine row. The net effect on total ETc can be near zero.
Drip irrigates the vine root zone, not the cover crop. So your vine can sit well-watered while the midrow cover starves. That's often the plan (you want to slow cover crop growth mid-season), but know that a badly desiccated midrow during a heat event can pull some vine root water uptake and shave the accuracy of ETc-based predictions. Watching stem water potential alongside your ETc numbers keeps you honest about whether the actual vine tracks your model.
What records do you need to keep for irrigation compliance and audits?
Irrigation record-keeping depends on your state and your market channel. Here's the reality across common cases.
In California, growers supplying grapes under water-limited basin adjudications (common in the Central Valley) may face volumetric water use reporting under the State Water Resources Control Board. Reporting usually means monthly applied water volumes by field or sub-unit [7]. Under the Sustainable Groundwater Management Act (SGMA), growers in critically overdrafted basins may also report water use to their Groundwater Sustainability Agency, with reporting periods that vary by GSA [7].
For growers certified under third-party sustainability programs (Lodi Rules, SIP Certified, CCOF Organic), irrigation logs typically need date, duration, volume applied, and often a note of the ETo or soil moisture that triggered the event. These programs don't mandate ETc scheduling, but documenting your ETc calculations shows irrigation decisions rest on data, which auditors like to see.
Pesticide records and irrigation records intersect when chemigated treatments (fertilizers or certain soil-applied pesticides through drip) are involved. California DPR requires fertigation and chemigation events be logged under the Pesticide Use Report system when restricted materials go through the irrigation system [8]. EPA's Worker Protection Standard also requires documentation of pesticide applications and applicable re-entry intervals, including water-sensitive applications [9].
A practical minimum log: date, block identifier, irrigation zone, start time, duration, emitter flow rate (or total volume from your flow meter), weather conditions or ETo source, and any soil or plant water status readings. That covers most audit requirements and lets you reconstruct the season's water use if questioned. VitiScribe's field records module logs irrigation events with ETo and Kc attached, and exports cleanly to the formats most California GSAs request.
What are the most common ETc scheduling mistakes vineyard managers make?
Using the wrong ETo station. If the nearest CIMIS or AgWeatherNet station sits in a different elevation band or coastal influence zone than your vineyard, your base ETo can be off 10 to 20% every day. That error compounds all season.
Using a fixed Kc all season. Some managers grab a single number, often 0.50, and run it from May through harvest. That overwaters early when the canopy hasn't closed, and misses the target post-veraison. The entire point of ETc scheduling is that Kc tracks growth stage.
Ignoring system efficiency. An emitter that's 25% clogged delivers 75% of its rated output. Calculate runtime off the rated GPH without checking actual output and your vines get less water than you think. Catch it with a catch-cup test once a year [4].
Mishandling rainfall. Many controllers can't sense rain well, and it's tempting to skip the math. But every 0.10 inch of measurable rain hitting the drip zone can offset about half a day's ETc in mid-season. Over a week with two small rain events, skipping the adjustment means you apply a full day's worth of excess water.
Stacking stress periods by accident. Pre-bloom stress plus post-veraison RDI plus a mid-September heat spike can compound into vine damage that only shows up as weak budbreak next spring. The fix is to treat your stem water potential readings as the override signal. If the plant is more stressed than your ETc model predicts, adjust up and find out why.
How do ETc-based schedules compare to soil sensor scheduling or appearance-based scheduling?
These aren't competing methods. They complement each other, and the best-run vineyards use all three as a cross-check.
ETc scheduling is demand-side. It tells you how much water the vine theoretically needs based on weather. It's proactive: you know Tuesday's need on Monday morning from the forecast.
Soil sensor scheduling is supply-side. It tells you what's actually in the root zone right now. A capacitance reading that drops faster than your ETc model predicts points to one of three things: the soil is drier than you assumed, roots are shallower than assumed, or a leak is pulling water away from the zone. Any of those means investigate.
Appearance-based scheduling, watching for leaf rolling or color change, is a lagging indicator. By the time you can see stress in well-adapted Vitis vinifera, stem water potential is already below negative 12 to negative 14 bars, at or past the onset of deficit for sensitive stages [5]. For a grower with decades on one site, visual cues are useful context. For anyone else, they're too slow.
WSU's Irrigated Agriculture Research and Extension Center at Prosser has published decision-tree tools that combine ETc with soil water depletion thresholds and pressure bomb readings into a weekly workflow [3]. That's probably the most organized approach for growers who want to formalize their methods without drowning in math.
For the record, none of these methods erases uncertainty. ETc models rest on weather station data that may not match your microsite. Soil sensor accuracy depends on probe placement and calibration. Pressure bombs demand proper technique or the readings mean nothing. Honest irrigation scheduling is iterative. You make your best estimate Monday, then use sensor and plant data to adjust.
Frequently asked questions
What is the crop coefficient (Kc) for wine grapes at full canopy?
At full canopy closure, typically mid-June through late July in California's Central Valley, wine grape Kc runs about 0.55 to 0.70. The exact number depends on actual fractional canopy cover. A vine shading 70% of its row area has roughly 70% of the Kc of a vine at complete canopy cover, based on the method Williams and Ayars published in 2005.
How often should I irrigate with a drip system using ETc scheduling?
Frequency depends on your soil's water-holding capacity and daily ETc. Sandy soils with low plant-available water may need irrigation every 2 to 3 days in peak summer. Loam or clay-loam soils with a 3-foot root zone usually hold 7 to 12 days of ETc before hitting a 50% depletion threshold. Most drip systems on loam run one or two events per week in midsummer.
Where do I get free daily ETo data for my vineyard?
California growers use CIMIS (cimis.water.ca.gov), roughly 145 stations reporting Penman-Monteith ETo daily at no cost. Washington growers use WSU's AgWeatherNet. Oregon and Idaho growers use USBR AgriMet. Each system needs you to find your nearest station, ideally within 10 to 15 miles and at a similar elevation and coastal influence to your vineyard.
What is regulated deficit irrigation and does it work for wine grapes?
Regulated deficit irrigation (RDI) means intentionally replacing only 40 to 60% of ETc during set periods, usually post-veraison through harvest. UC Davis research found post-veraison RDI at 50% ETc reduced berry weight by 12 to 18% and raised anthocyanin concentration. It works, but only with pressure bomb monitoring to confirm stem water potential stays above negative 16 to negative 18 bars.
How do I convert ETc in inches to drip system runtime?
Multiply ETc in inches by 0.623 for gallons per square foot. Multiply by your vine's ground area (row spacing times vine spacing) for gallons per vine. Divide by your emitters' total GPH per vine. Then divide by your distribution uniformity as a decimal (0.90 for 90% DU) to get runtime in hours. Example: 0.21 inches ETc, 60 sq ft per vine, 2 GPH emitters, 90% DU = 4.3 hours.
Does a cover crop change the Kc I should use?
Yes. A living, actively growing midrow cover crop adds evapotranspiration demand beyond what vine Kc tables assume. California extension guidance generally adds 0.10 to 0.20 to the vine Kc during periods of active cover crop growth. A mowed or desiccated midrow adds very little to total ETc and can mostly be ignored in your calculation.
How accurate are ETc-based irrigation schedules compared to what the vine actually needs?
On a well-calibrated system with a nearby weather station and correct Kc, ETc scheduling typically comes within 10 to 15% of actual vine water demand. Soil moisture sensors and weekly stem water potential readings close that gap. Nobody has perfect data across all sites, but the FAO Penman-Monteith method, the standard basis for ETo, is well validated for warm, semi-arid grape regions.
What's the minimum irrigation log I need for a California sustainability audit?
Most California third-party sustainability audits (Lodi Rules, SIP Certified) want date, block ID, irrigation zone, duration or volume applied, and the trigger for the event. Noting your ETo source and Kc shows a scientific basis. California State Water Board reporting for adjudicated basins requires monthly volumes by field unit. Check your specific GSA or water district for local requirements.
Can I use smartphone apps instead of calculating ETc manually?
Several apps pull live ETo from CIMIS or AgWeatherNet and let you enter Kc and system specs to output a runtime. IrrigationSCHEDULER from USBR and the UC ANR climate tools both do this at no cost. Apps handle the math fine, but you still need to enter the correct Kc for each growth stage and keep your system's distribution uniformity current.
At what growth stage should I stop irrigating wine grapes before harvest?
Most protocols cut irrigation to 30 to 50% of ETc in the final 3 to 4 weeks before harvest and may stop entirely 7 to 14 days out, depending on the season and style target. Timing depends on your stem water potential readings more than a fixed date. Stopping too early in a heat year can push vines past negative 20 bars, which damages both the current crop and next year's canes.
How does drip emitter spacing affect my ETc-to-runtime calculation?
Emitter spacing changes the wetted area and how many emitters each vine has. Two emitters per vine at 1.0 GPH each delivers 2.0 GPH per vine. Three emitters at 0.5 GPH delivers 1.5 GPH. What matters for runtime math is total GPH per vine, not spacing alone. Spacing does affect lateral water movement in soil, which matters more for root zone coverage than for the ETc math.
What is distribution uniformity and how do I test it?
Distribution uniformity (DU) measures how evenly a drip system delivers water across all emitters. Test it by collecting output from at least 16 emitters across the zone, averaging the lowest 25% of outputs, and dividing by the overall average. A DU above 90% is good. Below 80%, uneven watering is significant enough to hurt both your ETc calculations and vine consistency. UC Cooperative Extension recommends annual DU testing.
Is ETc scheduling useful in cool coastal vineyards or just in hot inland sites?
ETc scheduling works everywhere, but the stakes differ. In cool coastal sites, ETo is much lower, daily and weekly ETc values are smaller, and soils have longer effective intervals between irrigations. Overwatering risk is higher in cool, foggy zones because ETo is low but growers may still run schedules calibrated for inland conditions. ETc calculation prevents that. UC Davis extension covers coastal Kc adjustments in its vineyard water use publications.
How do I handle an unexpected heat spike within my weekly ETc schedule?
A multi-day heat event can double or triple normal ETc. If your scheduled irrigation doesn't cover the spike and your soil reservoir runs out before the next run, vines can stress fast, especially young vines with shallow roots. The fix is to check your CIMIS or AgWeatherNet forecast daily during heat events and run a supplemental irrigation if the week's accumulated ETc exceeds your soil's 50% depletion threshold ahead of schedule.
Sources
- FAO, Irrigation and Drainage Paper No. 56 (Allen et al., 1998): Establishes the Penman-Monteith ETo calculation method and the dual-crop coefficient framework (ETc = ETo × Kc) used worldwide for irrigation scheduling
- California Department of Water Resources, CIMIS: CIMIS operates approximately 145 automated weather stations reporting daily Penman-Monteith ETo for California growers at no cost
- Washington State University, AgWeatherNet and Irrigated Agriculture Research and Extension Center: WSU publishes regulated deficit irrigation protocols for wine grapes and hosts AgWeatherNet ETo data for Washington growers
- University of California Agriculture and Natural Resources, Vineyard Water Use and Irrigation Scheduling: UC Cooperative Extension publishes county-level seasonal ETo summaries, Kc tables for wine grapes by growth stage, and distribution uniformity testing protocols for drip systems
- Williams L.E. and Ayars J.E. (2005), Agricultural Water Management, Grapevine water use and the crop coefficient: Williams and Ayars found that grapevine Kc scales roughly linearly with fractional canopy cover; stem water potential targets for managed deficit range from negative 12 to negative 16 bars post-veraison
- Irrigation Science, 2021, Satellite-derived crop coefficient review: A 2021 review in Irrigation Science found satellite-derived Kc estimates within 8 to 12% of ground-measured values for tree and trellis crops
- California State Water Resources Control Board, Sustainable Groundwater Management Act: SGMA requires water use reporting for growers in critically overdrafted basins; reporting periods vary by Groundwater Sustainability Agency
- California Department of Pesticide Regulation, Pesticide Use Reporting: California DPR requires that restricted materials applied through drip irrigation systems (chemigation) be logged under the Pesticide Use Report system
- U.S. EPA, Agricultural Worker Protection Standard (40 CFR Part 170): EPA Worker Protection Standard requires documentation of pesticide applications and applicable re-entry intervals, including water-sensitive applications via irrigation systems
- University of California, Davis, viticulture and enology research on regulated deficit irrigation: UC Davis viticulture research documents post-veraison RDI at 50% ETc reducing berry weight by 12 to 18% while increasing anthocyanin concentration with no statistically significant yield penalty under monitoring
- USDA Bureau of Reclamation, AgriMet and IrrigationSCHEDULER tool: USBR's AgriMet network provides daily ETo for Pacific Northwest growers and its IrrigationSCHEDULER tool calculates ETc-based irrigation timing at no cost
Last updated 2026-07-11