How to set up a vineyard pest monitoring schedule and document results

TL;DR
- A vineyard pest monitoring schedule means walking blocks on a fixed timetable (weekly through the growing season at minimum), recording pest counts against action thresholds at each scouting stop, and logging results in a format that drives spray decisions and satisfies EPA Worker Protection Standard recordkeeping.
- Start with your region's UC Davis, Cornell, or WSU threshold tables, then anchor the calendar to phenological windows.
Why does structured pest monitoring matter more than spraying on a calendar?
Calendar spraying feels safe. You spray every 14 days regardless of what's actually in the vineyard, and you sleep at night. The problem is that you end up buying pesticides you didn't need, building resistance in the pest population, and stacking up re-entry interval paperwork for nothing. Scouting-driven programs beat calendar programs on all three counts.
The UC Davis Integrated Pest Management program, one of the most cited in the western U.S., puts it plainly: decisions should come from monitoring data and established action thresholds, not from assumptions about what must be present [1]. That has practical teeth. Scout and find grape leafhopper nymphs below the economic threshold of 15 to 20 nymphs per leaf (the range WSU uses as a rough trigger), and you don't spray. That's a saved application.
For small operators, the paperwork side matters as much as the agronomy. EPA's Worker Protection Standard (40 CFR Part 170) requires that certain pesticide application and safety information be kept and made accessible to workers and handlers [2]. A scouting log that feeds straight into your spray records builds an audit trail showing why you applied what you did, when you did it. That chain of evidence is what protects you in a compliance review.
Structured monitoring also trains your eye. The first season you scout seriously, you're learning what normal looks like in your specific blocks. By year three, you'll catch a mite outbreak two weeks earlier than you would have.
What pests should a vineyard monitoring program actually track?
The honest answer: the ones that are problems in your region and your variety mix. A program tracking 30 pests you'll never see is administrative noise. Start with a short list pulled from your local extension pest management guides.
For most North American wine grape regions, the core list looks something like this:
| Pest | Primary monitoring method | Typical action threshold |
|---|---|---|
| Grape berry moth (GBM) | Pheromone trap catch + degree-day model | Varies by model; NEWA uses 810 DD base 50°F for 1st gen [3] |
| Grape leafhopper | Visual leaf counts, nymphs per leaf | 15-20 nymphs per leaf (WSU) [4] |
| Two-spotted spider mite | Leaf samples, motile mites per leaf | 20-30 motiles per leaf (varies by region) |
| Vine mealybug | Sticky traps + visual | Presence in high-risk blocks often triggers action |
| Powdery mildew | Visual (flag shoots), mildew risk models | Infection period tracking |
| Botrytis | Visual, bunch inspections | Depends on variety and canopy density |
| Western grapeleaf skeletonizer | Visual leaf damage | Region-specific |
This isn't a universal list and it isn't exhaustive. Napa Valley operators deal with glassy-winged sharpshooter. Finger Lakes growers watch spotted wing drosophila harder than most. Willamette Valley has its own mite pressure patterns. Pull your state extension's current pest management guide and build your list from that.
Cornell Cooperative Extension publishes annual pest management guidelines for New York vineyards, updated with current threshold data [5]. WSU Extension does the same for Washington and Oregon through the Pacific Northwest Pest Management Handbooks [4]. UC Davis IPM online carries region-specific advisories for California [1]. Use them.
How often should you scout each block, and does it depend on the time of year?
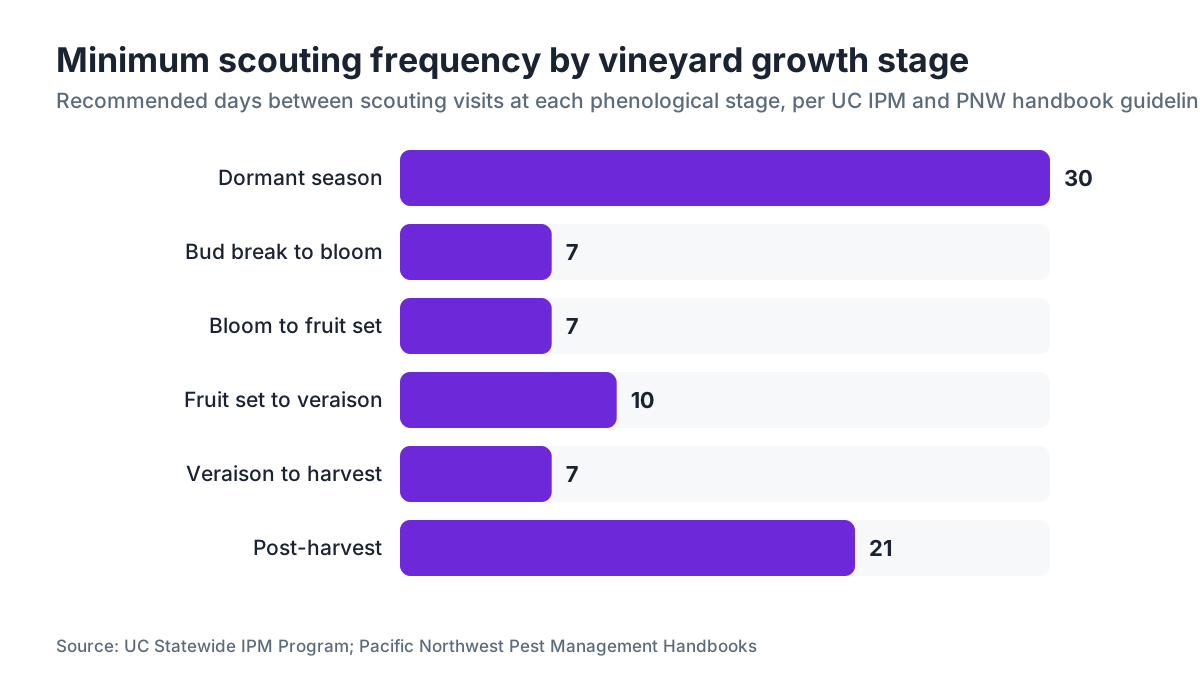
Frequency follows risk. During dormancy, you might walk blocks once a month to check for overwintering egg masses and trunk disease symptoms. Once buds start swelling, the interval tightens.
A workable baseline for the growing season:
- Bud break through bloom: every 7 days, minimum. Grape berry moth first flight overlaps with shoot development, and powdery mildew infection periods are most dangerous now.
- Bloom through veraison: every 7 to 10 days. GBM second generation, leafhopper second generation, mite pressure building.
- Veraison through harvest: every 5 to 7 days. Botrytis, spotted wing drosophila where relevant, late-season leafhoppers.
- Post-harvest through dormancy: every 2 to 4 weeks. Trunk disease assessment, mealybug egg mass counts.
These are starting points, not gospel. A wet July with heavy powdery mildew pressure might push you to twice-weekly inspections of susceptible varieties. A cool, dry season lets you stretch intervals. The schedule exists to give you a structure you can then adjust with judgment.
Block size matters too. A 20-acre block shouldn't get the same number of stops as a 2-acre block. The general convention in IPM literature is 5 to 10 sampling sites per block, spread to capture variation in soil type, row orientation, vine age, and proximity to woodland edges [1]. Mark those stops with flags or GPS coordinates and return to the same spots every time. Consistency beats random walking.
What does a practical scouting route and sampling protocol look like?
Pick a Z-pattern or W-pattern through the block so you hit both headland vines and mid-block vines. Skip the first and last rows. They behave differently because of edge effects.
At each stop, record the same observations every time. For leafhopper, pull one leaf from the basal cluster of a randomly chosen vine, count nymphs on the undersurface, and note leaf position. For spider mites, pull leaves from several canopy positions because mite distribution is patchy. For grape berry moth, read the pheromone trap catch and reset the trap.
Bring a hand lens (10x minimum), a printed or digital tally sheet, and ideally a degree-day printout from a weather tool like NEWA (Network for Environment and Weather Applications) or the UC IPM degree-day calculator [3][9]. Degree-day data gives your trap catches context. A GBM catch of 5 moths per trap per week at 400 degree-days base 50°F means something very different than the same catch at 750 degree-days.
Photo documentation is underrated. A $15 clip-on macro lens for your phone and a few shots of the worst-affected vines at each visit gives you a timestamped visual record. That record is genuinely useful when you're trying to figure out, in October, whether what you're seeing now started in June.
How do you set up pheromone and sticky traps for grape berry moth and other key pests?
Pheromone traps are the backbone of grape berry moth monitoring. The standard rig is a delta trap or wing trap with a lure specific to the pest. Place traps before biofix, the date sustained adult flight begins, usually defined as 2 or more moths caught per trap per week [3].
Placement guidelines that actually matter:
- One trap per 5 to 10 acres for GBM, per most extension recommendations. For blocks with a history of high pressure, one per 5 acres is smarter.
- Hang traps at mid-canopy height, inside the row, not on end posts where equipment clips them.
- Orient the opening away from prevailing wind so the plume drifts into the row.
- Replace lures on the manufacturer's schedule, typically every 4 to 8 weeks depending on formulation.
- Check traps twice a week during flight periods, once a week otherwise.
For vine mealybug, sticky traps catch crawlers, but their real value is telling you mealybug is present and active, not giving you a precise population estimate. Pair trap data with visual inspections of bark plates and the root crown.
Log every trap check: date, trap ID, location, count, lure change date. Over time this becomes your flight curve data, which lets you compare year-over-year pressure trends in your own vineyard.
What information goes into a scouting record, and how should you format it?
The minimum viable scouting record holds: date, block ID or name, scouting operator name, pest or condition observed, count or rating, location within block (stop number or GPS), and an action recommendation (treat, monitor, no action).
A fuller record adds vine phenological stage (the BBCH scale is the most transferable standard), weather at the time of scouting, degree-day accumulation to date for key pests, attached photos, and the threshold value you're comparing your count to, with the source of that threshold.
Why log the threshold source? Because thresholds aren't universal. The 15 to 20 nymphs per leaf figure for leafhopper is a rough guide that shifts by region, variety, and time of season. If a compliance review or a lawsuit asks why you did or didn't treat, you want to show you worked from a documented, citable standard, not a guess.
Format options:
- Paper tally sheets: simple, works offline, vulnerable to water and loss.
- Spreadsheet with one row per scouting event: easy to set up, easy to query, still requires manual entry from field notes.
- Field-first mobile apps built for pest scouting: cut transcription errors, timestamp and geolocate entries automatically.
Whatever format you use, back it up. Paper gets wet. Laptops die. A spray record audit going back three years is not the moment to find out your logs are gone.
This is where a tool like VitiScribe takes friction out of the process. It's built for vineyard field records, so your scouting logs and spray applications live in one system and cross-reference automatically. That pays off at the end of a season when you're reconstructing why you made specific treatment calls.
How do scouting records connect to your pesticide application records and EPA WPS compliance?
The EPA Worker Protection Standard (40 CFR Part 170) requires agricultural employers to keep specific records when pesticides are applied: product name, EPA registration number, active ingredient, location treated, date and time of application, and the applicable restricted-entry interval [2]. That's the federal floor. Most states add requirements on top.
Your scouting records don't appear in the WPS list by name, but they're the logical precursor to every application decision. A complete chain reads like this: scouting record (pest X found at count Y on date Z) leads to treatment decision (threshold exceeded, product A selected) leads to application record (product A applied to block B on date C by operator D, REI = 24 hours) leads to posted entry restriction (the WPS-required posting at the field entry point).
California goes further. The California Department of Pesticide Regulation requires pesticide use reports for every application of a restricted-use or permit-required pesticide, submitted monthly to the County Agricultural Commissioner [6]. Other states vary. Check with your state lead agency.
The WPS also requires that handlers and early-entry workers get safety training, that pesticide safety information be posted and accessible, and that decontamination supplies be available. Those requirements stand independent of your scouting program, but your application records feed straight into them [2].
Keep application records for a minimum of two years under federal WPS. California requires three. If you're in any certification program (organic, Certified Sustainable Winegrowing, LIVE), the retention window is usually longer.
How do you build a monitoring calendar across the full growing season?
Start with a printed or digital calendar for your USDA hardiness zone and typical season. Then anchor your monitoring to phenological events rather than fixed dates, because phenology moves year to year.
A practical seasonal structure:
Dormant season (December through bud swell)
Walk blocks monthly. Look for Eutypa dieback symptoms on pruning wounds, overwintering mealybug egg masses under loose bark, and gopher or vole activity. No traps yet.
Bud break to bloom (March/April through May/June depending on region)
Deploy GBM pheromone traps before biofix. Begin weekly scouting. Start degree-day tracking. Watch for powdery mildew flag shoots. Record BBCH stage at each visit.
Bloom through fruit set (May/June through July)
The most infection-critical stretch for powdery mildew and botrytis. GBM first generation egg-laying and larval activity. Leafhopper first generation adults and eggs. Scout every 7 days minimum. Check mildew infection period models.
Fruit set through veraison (July through August)
GBM second generation. Leafhopper second generation nymphs. Mite populations can build fast in heat. Vine mealybug crawlers active. SWD becomes relevant in late-ripening varieties near veraison.
Veraison through harvest (August/September through October)
Botrytis inspection of bunches weekly. GBM third generation in three-generation regions. SWD trap monitoring. Leafhopper third generation.
Post-harvest (October through dormancy)
Final mealybug assessment. Eutypa and other trunk disease survey. Note the blocks with highest pressure this season to set next year's monitoring priority.
Build this into a spreadsheet or calendar at the start of each season and assign specific scouting dates to specific staff. Vague plans get skipped. Named dates with named owners get done.
What are action thresholds and how do you use them to make spray decisions?
An action threshold is the pest population level at which you take control action. Below it, you monitor. At or above it, you treat, or use a non-chemical intervention depending on your program.
Thresholds exist because some pest presence doesn't cause economic damage. Killing every leafhopper in the vineyard when there are 5 nymphs per leaf costs more money and does more harm to beneficial insects than those 5 nymphs ever would.
Where do the numbers come from? University research trials that measure yield and quality damage at varying pest densities. UC Davis, Cornell, and WSU have all published threshold data for their regions [1][4][5]. The catch: thresholds are population estimates from research conditions, and they may not match your variety, your market, or a year where multiple stressors stack. Treat published thresholds as your starting point and adjust with local knowledge over time.
Grape berry moth is different. The threshold isn't a simple count. The NEWA GBM model uses degree-day accumulation from biofix to predict generation timing, and the action recommendation is timed to specific development windows [3]. A raw trap catch of 30 moths per trap per week sounds alarming, but if you're 1,200 degree-days past biofix and second-generation egg-laying already peaked, a spray at that moment mostly wastes product. The degree-day model saves you from that mistake.
Document every threshold comparison in your scouting record. Write down the pest observed, the count or rating, the threshold value used, the source of that threshold, and your action decision. That's the documentation that shows you're managing pests on evidence.
How should you document scouting results so they're audit-ready and actually useful next season?
There's a difference between records you create for compliance and records you actually use. The goal is one system that does both.
For audit-readiness, records need to be complete (every visit logged, no gaps), consistent (same fields every time), attributed (who scouted), dated accurately, and retained for the required period.
For real utility, records need to be queryable (you can ask what leafhopper pressure looked like in Block 4 during June over three years), comparable across seasons, and linked to your application records so you can judge whether a spray decision worked.
End-of-season review is where the learning happens. Pull the year's scouting logs and ask: which blocks hit threshold earliest and most often? Which pests came in lighter than you expected? Were there gaps in your schedule during a weather event that could have hidden an outbreak? What was your average interval between threshold exceedance and application, and was it short enough to matter?
A one-page seasonal summary per block, written in October, is the single most useful document you can produce from a year's data. It becomes your management brief for the following season.
VitiScribe's field records module keeps scouting logs, spray records, and application justifications in one place, so the seasonal review doesn't mean rebuilding the picture from scattered spreadsheets and paper. Use that or a folder of well-organized spreadsheets. The principle holds either way: your records should be useful to future-you more than they're merely compliant today.
Do organic vineyards need a different monitoring approach?
The monitoring approach is the same. The action thresholds and the list of available responses are different.
Organic certification under the USDA National Organic Program requires that cultural and biological controls come before any material application [7]. That makes your scouting records carry more weight in an organic program, because they document that you spotted the problem, judged its severity, and chose the least-toxic effective option. An organic certifier auditing your spray records wants proof the application was a reasoned response to a documented problem, not a reflexive calendar spray.
Some materials common in conventional programs (synthetic pyrethroids, some organophosphates) aren't allowed in organic ones. That shifts the calculus on threshold decisions. If your only effective organic option for a pest costs more per application or has a narrower efficacy window, you may need to act at a lower threshold than a conventional program would.
The OMRI (Organic Materials Review Institute) list is the standard reference for approved materials [8]. Cross-check your scouting-triggered decisions against OMRI and your certifier's requirements before you apply anything.
What technology and tools actually help with pest monitoring, and what's a waste of money?
Worth it: a quality degree-day model, free through NEWA or the UC IPM degree-day calculator [3][9]. These change how you read trap data and time applications. A 10x hand lens. A basic digital scale and dissecting kit if you're doing visual counts of small pests. Reliable pheromone traps from an established supplier (Trece, ISCA Technologies, and Great Lakes IPM are all real companies with documented lure quality).
Also worth it: a GPS app on your phone to mark scouting stops the first season. After that you know where they are, but the coordinates end any question about consistency.
Waste of money for most small operations: automated in-field sensors that claim to detect pest populations passively. The technology is real in a research context, but the accuracy and calibration most commercial products deliver aren't there yet for routine farm use. Nobody has great independent data on this for vineyards specifically. Ask your local extension before buying.
Drone-based canopy assessment for disease pressure is promising and getting better, but it's still mostly a precision agriculture research tool. For a 30-acre family vineyard, a person with a hand lens walking a consistent route catches problems earlier and cheaper than most current drone platforms.
Free, reliable, and underused: your county farm advisor or viticulture extension advisor. UC Cooperative Extension advisors, Cornell Cooperative Extension county offices, and WSU extension offices all offer on-farm advisory visits. The advice is calibrated to your region and usually free or low-cost. Use it.
Frequently asked questions
How many scouting stops do you need per vineyard block?
Most IPM guidelines recommend 5 to 10 sampling sites per block, spaced to capture variation in soil, row orientation, and vine age. A small 2-acre block can work with 5 stops. A 20-acre block warrants 10 or more. Mark stops with flags or GPS coordinates and return to the same locations every visit, otherwise your data isn't comparable across dates.
What records does the EPA Worker Protection Standard actually require vineyards to keep?
Under 40 CFR Part 170, agricultural employers must keep records of each pesticide application including the product name, EPA registration number, active ingredient(s), crop treated, location, date and time, and the restricted-entry interval. Federal rules say keep records at least two years. California and some other states require three. Check your state's specifics with your state lead agency for pesticide regulation.
When should I put out grape berry moth pheromone traps?
Place GBM traps before biofix, typically when temperatures stay consistently above 50°F and adult flight is expected. In the northeastern U.S. that's often late April to early May. In warmer regions, earlier. The NEWA GBM degree-day model uses biofix (2 or more moths caught per trap per week on two consecutive checks) as the starting point for all later generation timing predictions.
Can I use the same action thresholds as a vineyard in another state?
Not reliably. Thresholds come from research at specific locations and may not account for your variety, your market standards, or regional pest biotypes. UC Davis, Cornell, and WSU each publish region-specific thresholds. Use the guide from the extension program closest to your region as your baseline, then adjust with local advisor input over time.
How do I track degree days for grape berry moth without a weather station?
NEWA (Network for Environment and Weather Applications) pulls data from the nearest station in its network and calculates GBM degree-day accumulations for you, free. UC IPM has a similar web tool for California growers. If no nearby station exists, a min-max thermometer in the vineyard plus a manual average calculation (max + min divided by 2, minus base temperature) works reasonably well.
How long should I keep vineyard pest scouting records?
Federal WPS requires two years for application records. California requires three. Organic certification programs typically require five years. For your own management, keeping annual summary data indefinitely is worthwhile. Year-over-year block-level pressure data is one of the most useful tools you have for anticipating problems and judging whether your program works.
What's the difference between an action threshold and an economic threshold?
In strict IPM terms, the economic threshold is the pest density at which control costs equal the value of damage prevented. The action threshold sits slightly below that, timed so treatment starts before the economic threshold is reached. In practice, extension publications often use the terms interchangeably. What matters is working from a documented number with a cited source, not a guess.
Do I need to scout after harvest?
Yes, and many growers skip it to their detriment. Post-harvest scouting catches trunk disease symptoms (Eutypa, Esca) when they show most on senescing leaves, gives you a final mealybug and overwintering egg mass count, and flags which blocks had the most pressure so you can prioritize monitoring next spring. An hour per block in October saves time the following season.
How do I document a decision NOT to spray after scouting?
Write a scouting record with the pest observed, your count or rating, the threshold value and its source, and a one-line action decision: 'Count of 8 nymphs per leaf below WSU threshold of 15-20; no treatment, continue monitoring.' That record protects you as much as a spray record does. It shows you made a reasoned, documented decision rather than ignoring a problem.
What's the best way to organize scouting records across multiple blocks?
One record per scouting event (not one per block per season) with block ID as a field you can sort and filter by. Whether you use a spreadsheet or a dedicated field records app, each row should represent a single block visit on a single date. That makes it easy to pull all records for a block, or all records from a date range, without rebuilding data from scratch.
How do I train a new employee to scout vineyards accurately?
Start with a side-by-side field walk where you identify each target pest and show what a threshold-level infestation looks like versus background presence. UC Davis and Cornell IPM programs publish illustrated pest identification guides that work well as field references. Have new scouts count the same sample you've already counted and compare results before they scout alone. Consistency between operators matters as much as accuracy.
Are there free templates for vineyard pest scouting log sheets?
Yes. UC Cooperative Extension, Cornell Cooperative Extension, and WSU Extension all publish scouting forms and IPM worksheets, some as downloadable PDFs. Search the UC IPM website or your state's extension viticulture program page. These are good starting points, though you'll want to add columns for your specific block IDs, your threshold reference sources, and a field for action decisions.
Sources
- UC Statewide Integrated Pest Management Program (UC IPM), grape pest section: IPM decisions should be based on monitoring data and established action thresholds; UC IPM publishes region-specific thresholds for California wine grape pests
- EPA, Agricultural Worker Protection Standard (40 CFR Part 170): WPS requires agricultural employers to keep pesticide application records including product name, EPA registration number, active ingredient, location, date, time, and REI for at least two years
- NEWA (Network for Environment and Weather Applications), Cornell University, Grape Berry Moth model: NEWA GBM degree-day model uses 810 DD base 50°F for first generation timing and defines biofix as 2 or more moths caught per trap per week on two consecutive checks
- Pacific Northwest Pest Management Handbooks (WSU, OSU, University of Idaho): WSU and PNW handbooks use a rough action threshold of 15 to 20 grape leafhopper nymphs per leaf for regional wine grape vineyards
- Cornell Cooperative Extension, New York and Pennsylvania Pest Management Guidelines for Grapes: Cornell publishes annual updated pest management guidelines for New York vineyards with current action thresholds and monitoring protocols
- California Department of Pesticide Regulation, Pesticide Use Reporting program: California requires pesticide use reports for every application of a restricted-use or permit-required pesticide, submitted monthly to the County Agricultural Commissioner; records must be retained for three years
- USDA Agricultural Marketing Service, National Organic Program: USDA NOP requires that cultural and biological controls be prioritized before any material application in certified organic production
- OMRI (Organic Materials Review Institute), OMRI Products List: OMRI publishes the standard reference list of materials approved for use in certified organic production
- UC Statewide IPM Program, degree-day calculator (weather tools): UC IPM provides a free web-based degree-day calculator for California growers to track pest development accumulation from local weather station data
- Pacific Northwest Pest Management Handbooks: The Pacific Northwest Pest Management Handbooks cover action thresholds and scouting protocols for Pacific Northwest vineyards
Last updated 2026-07-10