How to set up an ET-based irrigation schedule and record it properly
TL;DR
- An ET-based vineyard schedule takes daily reference evapotranspiration (ETo) from a local weather station and multiplies it by a grapevine crop coefficient (Kc, usually 0.15 to 0.70 depending on growth stage and canopy) to size each irrigation.
- You log every event with date, zone, runtime, and applied volume.
- Most states and all federal programs require these records for at least 2 years.
What is evapotranspiration and why does it drive vineyard irrigation?
Evapotranspiration is water leaving your ground two ways at once: evaporation off the soil and transpiration through the leaves. For scheduling, we use ETo, the reference number a standardized grass surface would lose under your local weather. Your vines want a fraction of that, set by a crop coefficient.
Here's why the physics matter. Grapevines get deficit-irrigated on purpose in most quality wine programs. You're not replacing every drop lost. You're replacing a controlled percentage, tuned to vine size, growth stage, and the wine you want to make. Row crops and orchards chase full replacement. Wine grapes don't. So you read the raw ETo number and then deliberately shave it down, and that shaving is the whole job.
UC Davis Cooperative Extension has published grapevine crop coefficients for California since the 1980s, and those figures are still the most-used starting point for warm-climate vineyards [1]. Washington State University Extension covers coefficients for the Columbia Basin and similar continental climates [2]. Cornell Cooperative Extension work applies to the Northeast, where humidity and different canopy training move the numbers a lot [3].
The equation is short. ETc (crop evapotranspiration, your actual vine demand) equals ETo times Kc. If today's ETo is 0.30 inches and your midsummer Kc is 0.50, the vines theoretically want 0.15 inches. How much of that you actually give them depends on your deficit strategy.
Where do you get reliable ETo data for your vineyard location?
Your ETo source is the most important input in the whole system, and a station 20 miles off on different soil and elevation gives numbers wrong enough to bite you.
The California Irrigation Management Information System (CIMIS) is the standard for California growers. It runs more than 145 automated weather stations statewide and hands out daily ETo, wind, humidity, and solar radiation for free [4]. Pull data by station number, nearest coordinates, or spatial grid. The grid interpolation product helps when you're stuck between stations, though it adds some uncertainty.
Outside California, your options change:
- Washington: AgWeatherNet, run by WSU, covers the Columbia Basin and other regions [2]
- Oregon: Oregon State University's AgriMet network and the PRISM climate group provide regional data
- Idaho and the Mountain West: the Bureau of Reclamation's AgriMet system covers stations across seven western states [11]
- Northeast: NOAA's National Weather Service cooperative observer network, plus Cornell's Northeast Regional Climate Center [3]
- Nationally: if you have your own on-site weather station measuring temperature, humidity, wind, and solar radiation, the ASCE Penman-Monteith equation lets you calculate ETo yourself [5]
The most accurate setup for a serious operation is an on-site station feeding your own ETo calculation. A commercial-grade unit runs roughly $800 to $3,500, and the accuracy gain over a remote station is real in mountain or coastal sites where microclimates shift over short distances. Most growers on a nearby CIMIS or AgWeatherNet station still do fine.
One practical check: know how your reference station calculates ETo. Most, including CIMIS, use the ASCE Penman-Monteith equation. If you're pulling from an older station running Hargreaves or Blaney-Criddle, the numbers won't line up with published Kc values, and you'll have to reconcile the method before you trust the output.
What crop coefficient should you use for grapevines?
The crop coefficient (Kc) turns reference ETo into real vine demand, and for grapevines it is never one number. It moves through the season and shifts with canopy size, training system, and whether you're running full replacement or a deficit.
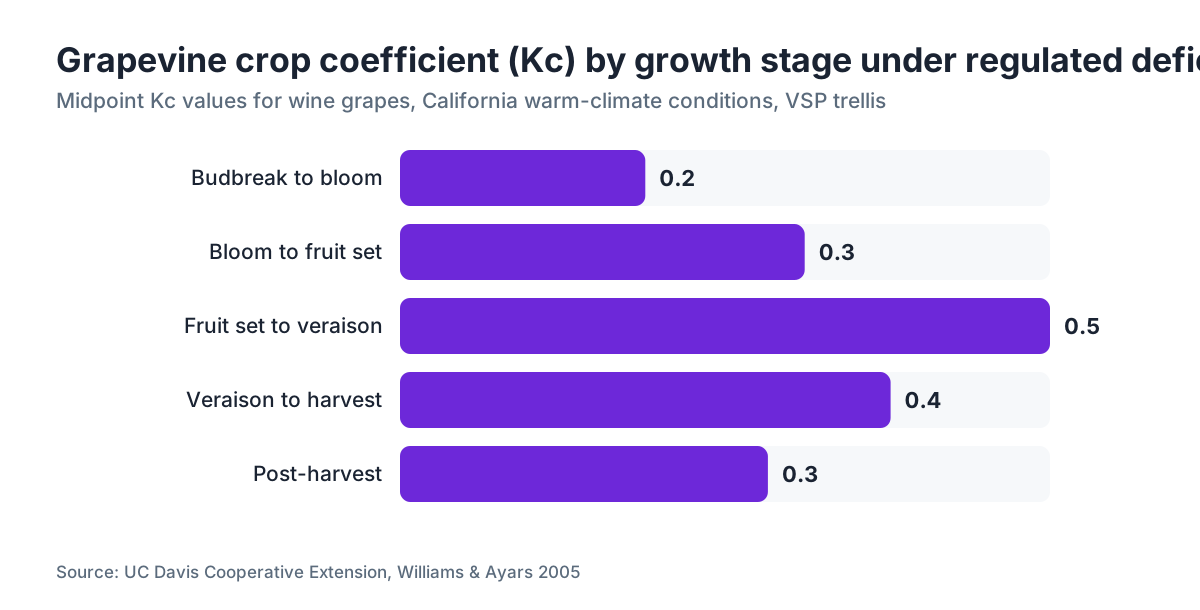
The UC Davis figures from Williams and Ayars (2005) are the most cited for California [1]. Their data puts midseason Kc anywhere from about 0.15 for small, tightly managed canopies under regulated deficit irrigation (RDI) up to around 0.70 for large canopies at full replacement. Here's the seasonal range under a standard RDI program for wine grapes:
| Growth Stage | Approximate Kc Range | Notes |
|---|---|---|
| Budbreak to bloom | 0.15 to 0.25 | Small canopy, minimal demand |
| Bloom to fruit set | 0.25 to 0.40 | Canopy expanding rapidly |
| Fruit set to veraison | 0.40 to 0.65 | Peak canopy, hottest period |
| Veraison to harvest | 0.30 to 0.50 | Often cut further for RDI |
| Post-harvest | 0.20 to 0.40 | Depends on whether you irrigate |
These are starting points, not answers. Your Kc also depends on row spacing, vine spacing, canopy height, and cover crops. A high-wire Lyre trellis with wide rows carries a different Kc than a VSP on 5-foot rows. Williams (2010) published a canopy-size adjustment method that many growers use to scale Kc to their own vine density [1].
WSU's Columbia Basin work puts midseason Kc at 0.45 to 0.65 for mature vines under full irrigation, dropping to 0.30 to 0.45 between fruit set and veraison under RDI [2]. Washington's cooler nights and lower vapor pressure deficit mean you often move a smaller absolute volume of water than the San Joaquin Valley even at the same Kc.
Honestly, your first year on ET scheduling, use the published coefficients and watch how the vines respond. Stem water potential from a pressure chamber is your ground-truth check. If the vines run much more or much less stressed than your target at midday, nudge Kc a little at a time. Nobody nails Kc from a published table alone the first season.
How do you calculate your actual irrigation volume from ETo and Kc?
Three steps. Find ETc, convert it to volume per vine or per acre, then account for your system's distribution uniformity.
Step 1: ETc (inches) equals ETo (inches) times Kc. Weekly ETo from CIMIS of 1.75 inches at a Kc of 0.45 gives a vine ETc of 0.79 inches for the week.
Step 2: convert to volume. One inch of water over one acre equals 27,154 gallons, or 3,630 cubic feet [12]. On drip, you work in emitters per vine and apply the per-vine math. At 4-by-8-foot spacing (1,362 vines per acre) with two 1-gallon-per-hour (GPH) emitters per vine, you need the wetted area per emitter in your soil to convert back to an equivalent depth.
Step 3: adjust for distribution uniformity (DU). A well-kept drip system runs 85 to 92% DU. To bring the least-watered vine up to target, you push the average application higher by a factor of 1/DU. At 88% DU, multiply your target volume by 1.14.
Here's a full example: 0.79 inches ETc for the week, drip, 90% DU, 6-by-10-foot spacing (726 vines per acre), two emitters per vine at 1 GPH.
- 0.79 inches over one acre = 0.79 x 27,154 = 21,452 gallons per acre
- Divide by 726 vines = 29.5 gallons per vine
- Adjust for DU: 29.5 / 0.90 = 32.8 gallons per vine
- Runtime per event: 32.8 gallons / 2 GPH per vine = 16.4 hours
Split that into two irrigations a week and you run about 8.2 hours each. You'll do this arithmetic in a spreadsheet, but grind through it by hand once so you understand what your controller is actually doing.
For multiple vineyard blocks with different soils and vine ages, run this calculation separately per zone. Older, deep-rooted vines reach more soil water and often need less than young vines under the exact same weather.
How do you set up the actual irrigation schedule, week by week?
The workflow is a weekly loop: pull ETo, apply Kc, calculate volume, check soil moisture and vine stress, adjust, irrigate, record.
Monday morning (or whatever day starts your irrigation week), download the past week's cumulative ETo from your station. Calculate ETc per block. Read any soil moisture sensors. Check last week's stem water potential. Then decide: replace 100%, 80%, 60% of ETc, or skip entirely if you caught rain or the vines are running ahead of your target stress.
For RDI, UCCE guidance holds midday stem water potential between roughly -8 and -12 bars from fruit set to veraison for most wine grape varieties, then lets it relax a little after veraison [1]. Those pressure chamber readings are your feedback signal. Consistently less stressed than target means you're over-irrigating and wasting water. More stressed means you either bump the replacement fraction or hunt for clogged emitters.
Set your controller to the calculated runtime on your chosen days. Hand-setting a basic timer? Write the setting into your log the same moment you enter it into the controller. Programming error is one of the most common reasons applied water drifts from calculated water.
Soil moisture sensors, whether tensiometers, capacitance, or granular matrix, add a real-time layer. They don't replace the ET math, but they show how your soil answers the schedule. Put sensors at two depths (usually 12 and 24 inches) in the wetted zone and you'll catch drainage below the root zone and dry pockets from emitter trouble.
A workable July rhythm for a California coastal wine grape block: ETo runs 0.25 to 0.30 inches a day. At Kc 0.45, ETc is 0.11 to 0.14 inches a day, roughly 0.75 to 1.0 inches a week. You irrigate Tuesday and Friday, replacing about 80% of ETc, and you verify against pressure chamber readings every Thursday. That's a clean loop you can hold all summer.
What records do you need to keep, and in what format?
This is where operations and compliance meet. Several programs require irrigation records, and your format decides how fast you can pull data for an audit or a water agency report.
At minimum, a compliant record for each event holds:
- Date and time of irrigation
- Block or zone identifier
- Runtime (start and end, or total hours)
- Applied volume (gallons or acre-inches, calculated or metered)
- ETo source and the daily or weekly value used
- Kc applied
- Calculated ETc
- Any adjustment made and why (sensor reading, rain, deficit decision)
- Meter reading before and after, if you have a flow meter
California's State Water Resources Control Board pushes water use efficiency documentation under the Agricultural Water Management Plan framework, which covers irrigation districts and large agricultural users [6]. Even if no AWMP touches you directly, ET-based records prove beneficial use, and that matters in a water rights fight.
Organic certification is stricter on retention. The National Organic Program (NOP) requires you to document all inputs and practices, irrigation included, as part of your farm system records, and 7 CFR 205.103 requires those records be kept for 5 years [7]. Your certifier will ask.
Sustainability programs like Lodi Rules and the California Sustainable Winegrowing Alliance (CSWA) score you on water use records and on running irrigation off plant or atmospheric data [8].
Paper logs work but have real limits. A spreadsheet with one row per event, linked to a tab holding your weekly ETo imports, does the math for you and exports clean for an audit. Tools like VitiScribe let you log events from the field with the ETo and Kc calculation built in, which kills the transcription errors that wreck most paper-to-spreadsheet systems. Whatever you use, keep the records. California DPR and most certification bodies require at least 2 years of irrigation and spray records, and NOP requires 5 [9].
How do you account for rainfall in your ET-based schedule?
Rain lowers your irrigation need, but rarely by the full amount that fell. The useful fraction depends on intensity, soil infiltration rate, and how dry the soil was going in.
The standard move is to subtract effective rainfall from your accumulated ETc. Effective rainfall is the part that reaches the root zone and stays available to the vines. Light, slow rain on dry soil is close to 100% effective. A 1.5-inch storm on already-wet heavy clay might deliver 40%.
Record every measurable rain event in your log with your on-site rain gauge reading, not the nearest town's station, which can be wildly different. Note the date, total precipitation, and estimated effective fraction. Then trim your next irrigation by that effective amount.
Some growers use a simple rule: subtract 80% of any rainfall under 0.50 inches and 60% of anything over. Others use the USDA Soil Conservation Service effective rainfall tables. Neither is exact. What matters is a consistent, written method.
Irrigate right after a real rain and you're wasting water and leaching nutrients past the roots. A tensiometer or capacitance sensor at 12 inches tells you the soil is already at field capacity. That's the sensor paying for itself.
Log rain events even when they change nothing. An auditor reading your records should see why you skipped an irrigation. "Received 0.65 inches effective rainfall, ETc deficit covered" is a complete, defensible entry.
How do cover crops and mulches change your ET calculations?
Cover crops raise your total demand because you're now evapotranspiring from two plant communities instead of one. The size of the bump depends on cover density, species, and whether the midrow is mowed or actively growing.
UC Cooperative Extension research in California found permanent cover crops can raise vineyard water use 15 to 40% versus bare or clean-cultivated midrows, depending on conditions [1]. That's a big number, and it's why some growers in dry country alternate managed cover with bare midrows.
The correction is a dual-crop-coefficient approach: estimate a Kc for the vines and a separate basal or evaporation coefficient for the midrow, then combine them [12]. Most growers simplify by using a higher Kc (say, 0.70 to 0.85 at midseason) while cover crops actively grow, then dropping back to the vine-only Kc after mowing or when the cover goes dormant in summer.
Mulch does the reverse. It cuts soil evaporation from the wetted zone and can lower effective demand 10 to 20% under the vine row. Switch from bare soil to under-vine straw mulch and you may need to shorten runtime to avoid over-irrigating.
Write these adjustments down. Note cover crop status, mowing date, and any Kc change. An auditor can follow the reasoning, and next season you can look back and see what your water use actually did when you changed the midrow.
What should your irrigation log template actually look like?
Here's a working template for a spreadsheet or paper log. The columns that carry the most weight are starred.
| Column | Example Entry |
|---|---|
| *Date | 2025-07-15 |
| *Block/Zone | Block 4, Cab Sauv VSP |
| Soil type | Loam, 3-5 ft effective depth |
| *ETo source | CIMIS Station 47 |
| *Weekly ETo (in) | 1.82 |
| *Kc applied | 0.45 |
| *Calculated ETc (in) | 0.82 |
| Effective rainfall (in) | 0.00 |
| *Replacement fraction | 80% |
| *Target applied (in) | 0.66 |
| DU adjustment | 90% DU, multiply by 1.11 |
| *Target volume (gal/acre) | 20,140 |
| Meter start | 14,522 gal |
| *Meter end | 35,018 gal |
| *Actual applied (gal) | 20,496 |
| *Runtime | 14.2 hours |
| Stem water potential | -10.5 bar (July 14 reading) |
| Sensor reading at 12 in | 28 centibars (tension) |
| Notes | Emitter flush on Block 4 row 7 |
| *Signed/Initials | JRW |
That template answers every question an auditor, water agency, or certifier throws at you. The starred columns are non-negotiable. The rest add context that makes you a better manager over time.
Water agencies usually want the "actual applied" column, especially in districts that track diversions or well pumping. For sustainability certification, the ratio of actual applied to calculated ETc (your applied fraction) is a key performance number. For your own management, the gap between target and actual tells you how the system is behaving.
Keep a separate log per block instead of one vineyard-wide log. It's almost always worth the extra work. Blocks carry different soils, vine ages, and Kc values, and mashing them into one entry makes the record useless for real decisions.
How does ET scheduling connect to pesticide and worker protection records?
Your irrigation schedule crosses paths with spray records in a few ways that matter for compliance.
First, some pesticide labels tie restricted-entry intervals to irrigation after application. Wetting soil or foliage after certain soil-applied herbicides can change efficacy or create drift risk. Read the label. Under the EPA Worker Protection Standard (WPS), you post REI information at the field and in a central location, and you keep application records at least 2 years [9].
Second, heavy irrigation right after a foliar application can wash off coverage or create runoff. Keep your irrigation log and spray log side by side so you can reconstruct the sequence if a question comes up.
Third, some California counties make growers report total water applied per acre for water conservation programs. Both DPR and your county ag commissioner's office might come looking. A legible ET-based log is a far better thing to hand an inspector than a stack of controller printouts with no notes.
EPA WPS handler records and California DPR pesticide use reporting share the same 2-year minimum [9]. Filing your irrigation and spray records together for the same block and window makes any review faster.
Retention isn't only about regulators. If you file a crop insurance claim, fight a water rights case, or answer a neighbor's runoff complaint, these records are your evidence.
How do you use pressure chamber readings to verify your ET schedule is working?
The pressure chamber, which measures midday stem water potential, is the single best tool for checking whether your ET schedule is hitting the vine stress you want. UCCE's published benchmarks are the most-used reference in California [1].
You measure by sealing a mature, shaded leaf in a foil or plastic bag at least 30 minutes before reading, then cutting the petiole and recording the pressure needed to push sap to the cut surface. Readings near 0 mean well-hydrated vines. More negative means more stress.
The UCCE guidelines for California wine grapes run like this:
- No stress (full replacement): -4 to -6 bars
- Mild to moderate stress (RDI target, pre-veraison): -8 to -12 bars
- Moderate to severe stress (intentional reduction, some varieties post-veraison): -12 to -16 bars
- Severe stress (risk of vine damage): below -16 bars
If your schedule is calculating deficit irrigation but the chamber reads -5 bars at midday, something's off. Your Kc is too high, your soil is releasing more water than you figured, water is moving in laterally from next door, or you have a leak. The pressure chamber catches the mismatch.
Log every reading in your irrigation record with date and time. Take readings from the same block, same vine position, same time of day each week (within an hour of solar noon is the standard). Shift the timing by more than 90 minutes and readings can swing 2 to 3 bars, which turns your trend data into noise.
Over a season you build a curve of how the block responds to your schedule. That curve is worth more than any published Kc table for managing the same site next year. It's also proof you're actively managing off plant response, which is exactly what sustainability programs want to see.
Can software or apps handle ET scheduling and record-keeping automatically?
Yes, and it cuts errors compared to hand-run spreadsheets, especially across multiple blocks, multiple zones, and seasonal workers doing entry.
The features worth wanting in any irrigation tool: automatic ETo import from CIMIS, AgWeatherNet, or your on-site station; a Kc library by growth stage and canopy type you can edit; per-block volume calculations; flow meter integration if you have one; and an export that produces a clean spreadsheet or PDF for compliance.
VitiScribe builds irrigation scheduling and logging into its field operations system, so the ETo fetch, Kc calculation, and record entry all live in one workflow instead of across three tools. That matters because the handoffs between steps are exactly where data quality dies.
If you want a standalone irrigation tool, several exist: CropManage (UC Cooperative Extension's free web tool), IrrigationVault, and SCADA-connected controllers from Netafim and Rain Bird that log their own application data [10]. None are complete for compliance on their own, because they don't tie in spray records, scouting records, and certifier reports the way a full compliance system does.
Whatever you run, spot-check it by hand at least once a month. Take the ETo from your source, do the Kc multiplication yourself, and compare to the software's number. Bugs and wrong Kc settings happen. Catching them in July beats catching them in December when your certifier is reviewing the whole season.
Frequently asked questions
What is the difference between ETo and ETc in vineyard irrigation?
ETo is reference evapotranspiration, calculated for a standardized grass surface from weather data. ETc is crop evapotranspiration, the actual water demand of your vines. ETc equals ETo times the crop coefficient (Kc). For grapevines under regulated deficit irrigation, midseason ETc usually runs 40 to 65% of ETo, so the two numbers differ a lot and you can't use ETo directly without the Kc adjustment.
How often should I update my crop coefficient through the season?
Most growers update Kc at each major growth stage transition: budbreak, bloom, fruit set, veraison, and post-harvest. That's roughly five changes a season. Some operations run a continuous curve, adjusting Kc weekly off canopy cover measurements. The growth-stage approach is practical and matches how published tables from UC Davis and WSU extension programs are built.
Do I need a flow meter on my drip system to keep ET-based records?
A flow meter isn't legally required in most states, but it's the only way to know your actual applied volume instead of your calculated target. Leaks, clogged emitters, and pressure swings all open a gap between calculated and applied. For water agency reporting and sustainability certification, metered data beats runtime estimates. A basic inline turbine meter runs $150 to $400 installed.
How much water do wine grapes typically need per acre per season in California?
It varies widely by region and deficit strategy. UC Cooperative Extension data suggests most California wine grape operations apply 8 to 24 acre-inches of irrigation per season, coastal at the low end and hot inland valleys at the high end. Full-replacement programs for table grapes and some varieties can top 36 acre-inches. RDI programs in Napa and Sonoma typically run 12 to 18 acre-inches.
What CIMIS station should I use if none is close to my vineyard?
CIMIS offers a spatial data service that interpolates ETo to any GPS coordinate using a grid model, rather than the nearest single station. You access it through the CIMIS website and get daily spatial ETo. For complex terrain or coastal fog zones, the spatial product is often more accurate than the closest station, which may sit at a very different elevation or microclimate.
How long do I need to keep vineyard irrigation records?
California DPR pesticide use records and EPA Worker Protection Standard records both require a minimum of 2 years. USDA organic certification under the National Organic Program requires 5 years of farm records. Some federal cost-share and conservation programs require 3 years. The safe move is to keep 5 years in one consistent format, which covers everything without juggling separate retention schedules.
Can I use an ET-based schedule without soil moisture sensors?
Yes. Plenty of growers run ET-based schedules on weather data plus pressure chamber readings, with no soil sensors at all. Sensors add useful real-time detail on how your soil buffers atmospheric demand and help catch malfunctions, but they aren't required for the calculation to work. If you can buy only one diagnostic tool, a pressure chamber ($300 to $600) tells you more about vine response than a soil sensor does.
How does regulated deficit irrigation differ from a full ET replacement schedule?
Full replacement targets ETc at 100%, holding vines at or near full water status. Regulated deficit irrigation (RDI) intentionally replaces only 50 to 80% of ETc during set growth windows, usually fruit set to veraison, to control shoot growth and berry size. RDI is the standard for most premium wine grape programs. After veraison, some operations move back toward full replacement to avoid stress carrying into the next season.
What is a good Kc value to start with for Cabernet Sauvignon in July?
For mature Cabernet Sauvignon on VSP trellis in a California warm-climate site, a July midseason Kc of 0.45 to 0.55 is a reasonable start under RDI. Large-canopy vines on wide rows run higher. Verify against the pressure chamber: if midday stem water potential is running less stressed than your -8 to -12 bar RDI target, drop your Kc or your replacement fraction.
Do ET-based irrigation records satisfy California sustainable winegrowing requirements?
The California Sustainable Winegrowing Alliance (CSWA) Sustainable Winegrowing Program gives credit for irrigation management based on atmospheric or plant water status data, which includes ET-based scheduling. Records showing ETo source, Kc values, calculated ETc, and applied volumes document exactly what CSWA auditors look for in water use efficiency. Add pressure chamber readings and you reach the top scoring tier.
What happens if my actual applied water is consistently higher than my ET calculation?
Consistently over-applying versus your ETc calculation usually means one of four things: your Kc is set too high, your distribution uniformity is worse than you thought (so you run longer to cover dry spots), you have a leak, or you have a math error in the calculation. Check emitters, run a catch-can distribution uniformity test, and verify your Kc against published tables for your canopy size and training system.
How do I calculate ET-based irrigation for young, non-bearing vines?
Young vines have tiny canopies and low Kc values, typically 0.05 to 0.15 in year one and 0.15 to 0.30 in year two, depending on canopy development. UC Davis extension recommends sizing water off wetted area rather than per-acre, since young vine root zones are far smaller than a mature vineyard. Water often in small amounts rather than rarely in big ones, and keep the emitter zone moist but not saturated.
Is there a free tool to calculate vineyard irrigation based on ET data?
Yes. UC Cooperative Extension's CropManage is a free web tool for California growers that pulls CIMIS ETo automatically and applies crop coefficients for several crops including winegrapes. It generates irrigation recommendations by block and tracks applied water. It was developed with UCCE and CIMIS. It doesn't handle spray records or full compliance documentation, but for the ET calculation itself it's a solid free option.
Do I need to record the ETo source in my irrigation log, or just the final numbers?
Record the ETo source by name and station number. If a water agency, certifier, or court ever audits your records, the source matters because it lets someone independently verify the number you used. An entry that reads '1.82 inches ETo, CIMIS Station 47, week of July 14-20, 2025' is verifiable. One that just says '1.82 inches' is not, and auditors notice the difference.
Sources
- UC Davis Cooperative Extension, Williams & Ayars 2005, Grapevine Water Use and Crop Coefficient: Grapevine midseason Kc values range from approximately 0.15 for small canopies under RDI to 0.70 for large canopies at full replacement; midday stem water potential targets for RDI run -8 to -12 bars from fruit set to veraison; permanent cover crops can increase vineyard water use by 15 to 40%.
- Washington State University Extension, AgWeatherNet and wine grape irrigation management resources: WSU midseason Kc values for mature Columbia Basin wine grapes range from 0.45 to 0.65 under full irrigation and 0.30 to 0.45 under RDI from fruit set to veraison.
- Cornell University Cooperative Extension, viticulture and irrigation resources for the Northeast: Cornell extension covers grapevine crop coefficients and irrigation management adapted to humid Northeast conditions and different canopy training systems.
- California Department of Water Resources, CIMIS (California Irrigation Management Information System): CIMIS operates over 145 automated weather stations across California and provides free daily ETo data, including a spatial interpolation product for sites between stations.
- American Society of Civil Engineers, ASCE Penman-Monteith standardized reference evapotranspiration equation: The ASCE Penman-Monteith equation is the standard method for calculating reference ETo from on-site temperature, humidity, wind, and solar radiation measurements.
- California State Water Resources Control Board, Agricultural Water Management Plans: California's SWRCB Agricultural Water Management Plan framework requires water use efficiency documentation for irrigation districts and large agricultural water users, and ET-based records demonstrate beneficial use.
- USDA Agricultural Marketing Service, National Organic Program regulations (7 CFR Part 205, section 205.103): The National Organic Program requires certified organic operations to maintain records of all inputs and practices, including irrigation, and 7 CFR 205.103 requires those records be retained for 5 years.
- California Sustainable Winegrowing Alliance, Sustainable Winegrowing Program self-assessment criteria: CSWA awards credit for irrigation management based on atmospheric or plant water status data, including ET-based scheduling with documented ETo, Kc, and applied volume records.
- US EPA Worker Protection Standard for Agricultural Pesticides (40 CFR Part 170): The EPA Worker Protection Standard requires pesticide application records to be retained for at least 2 years; California DPR imposes the same 2-year minimum for pesticide use reporting.
- UC Cooperative Extension, CropManage irrigation scheduling tool: CropManage is a free web-based irrigation management tool developed by UCCE that pulls CIMIS ETo data automatically and applies crop coefficients to generate irrigation recommendations by block.
- USDA Bureau of Reclamation, AgriMet weather station network: The Bureau of Reclamation AgriMet system provides ETo and weather data for agricultural users across seven western states outside California.
- UC Agriculture and Natural Resources, irrigation and evapotranspiration publications referenced in UCCE guidance: One inch of water applied over one acre equals 27,154 gallons; the dual-crop-coefficient approach is used to account for cover crop evapotranspiration separate from vine transpiration.
Last updated 2026-07-10