How to track spray program effectiveness by variety and rootstock combination

TL;DR
- Track spray effectiveness by variety and rootstock by recording disease incidence, canopy health scores, and yield data separately for each vine combination after every spray event.
- Compare results across at least two growing seasons.
- The most reliable signal is percent cluster infection at harvest, more than spray timing or product cost.
- You need block-level records, not farm-level averages.
Why does variety-rootstock combination change how a spray program performs?
Most spray program failures get blamed on the wrong product or the wrong timing. The real culprit is often the vine itself. A Cabernet Sauvignon on 110R behaves differently than the same scion on SO4 or 3309C. Shoot growth rate, cluster compactness, bark texture, and canopy density all shift based on the rootstock, and every one of those traits affects how a fungicide or insecticide actually reaches the target tissue and stays there. [1]
Rootstock also changes how the vine responds to disease pressure. Research from UC Davis on Phylloxera-resistant rootstocks has shown that water and nutrient uptake differences between rootstocks affect canopy microclimate, which directly shapes Botrytis and powdery mildew risk. [2] A block of Pinot Noir on 101-14 Mgt tends to produce a denser, more humid canopy than the same Pinot on Riparia Gloire, even under identical trellising. That microclimate difference can cut fungicide efficacy by 20 to 40 percent in high-pressure years, depending on product and timing.
Then there's the variety layer on top. Some varieties are structurally prone to tight clusters, which no spray program fully compensates for. Others have thick skins that slow Botrytis infection even without a spray. If you're evaluating your spray program at the farm level, you're averaging together vines with fundamentally different risk profiles and calling it a result. That tells you almost nothing useful.
The fix isn't more sprays. It's block-level tracking by combination, so you can see which variety-rootstock pairings are getting protection from your current program and which ones need a different product, timing, or canopy intervention before the spray even goes on.
What data do you actually need to collect for each block?
You need five categories of data, collected at the block level, tied to each spray event and each variety-rootstock combination. Everything else is optional.
1. Disease incidence and severity at key phenological stages. At bloom, veraison, and pre-harvest, walk each block and record the percentage of clusters showing infection (incidence) and an estimate of how much tissue is affected on infected clusters (severity). A simple 1-5 visual scale works for severity. Cornell's integrated pest management program recommends cluster counts of at least 50 per block to get statistically useful numbers. [3]
2. Spray event log with actual application parameters. Date, product, rate, water volume per acre, equipment type, canopy growth stage (using the BBCH scale is cleaner than colloquial descriptions), and wind speed at application. A missed spray or a spray applied at 18 mph wind matters enormously when you're comparing blocks, and if it's not recorded, it looks like a program failure when it's actually an application failure.
3. Canopy density measurement. Point Quadrat Analysis (PQA) or a simpler shoot-count-per-meter is enough. You need this because canopy density is the confounding variable between blocks on different rootstocks. Two blocks with identical spray records but different canopy densities are not comparable without it.
4. Yield and cluster weight by block. At harvest, weigh fruit by block and count clusters on a representative sample. Cluster weight differences tell you something about vine vigor that links back to rootstock, and ton-per-acre by block tells you whether disease-related crop loss is happening even when visual disease incidence looks low.
5. Pest trap counts if relevant. For leafhopper, mealybug, or grape berry moth, include trap counts on a per-block basis tied to spray events. Block-level pest pressure varies more than most growers expect, especially across rootstocks with different shoot timing.
A spreadsheet handles this fine for two to five blocks. Past that, the cross-referencing gets painful fast, and growers often stop entering data consistently. That's when software built for block-level spray records earns its keep. VitiScribe (vitiscribe.com) is designed specifically for this kind of block-level spray and outcome logging if you're looking for a purpose-built option.
How do you compare disease outcomes across different variety-rootstock pairings?
The comparison method matters as much as the data itself. Here's a straightforward framework:
Set a baseline year first. In year one, track all your blocks with the same program. Don't change anything. You're not testing yet, you're measuring. The goal is to see natural variation in disease incidence across your variety-rootstock combinations under a consistent spray program. That baseline is what all future comparisons run against.
Calculate infection rate per spray event, not per season. For each disease (powdery mildew, downy mildew, Botrytis separately), compute: percent cluster infection at each assessment date divided by cumulative spray events applied to that block by that date. This gives you a rough "infections per spray" figure that normalizes for spray frequency differences between blocks.
Control for weather. Disease pressure isn't uniform across your property. If block A is in a frost pocket that stays humid after rain and block B is on a well-drained knoll, that climate difference, not your spray program, may explain the outcome difference. WSU's Decision Aid System (DAS) provides hourly infection models for powdery mildew and Botrytis based on weather data. [4] Log the daily infection risk from a weather station on or near your property alongside your block records. When you compare two blocks, you want to know whether the higher-infected block also faced higher infection pressure, or whether it got the same pressure and failed to respond.
Use a simple comparison table each season. One row per variety-rootstock combination, columns for: total spray events, cumulative disease pressure index (from weather model), percent cluster incidence at pre-harvest, cluster weight (as a vigor proxy), and yield tons per acre. That table becomes your annual program scorecard.
| Variety | Rootstock | Spray events | Disease pressure index | Cluster incidence % | Yield (T/ac) |
|---|---|---|---|---|---|
| Cabernet Sauvignon | 110R | 12 | 8.4 | 3.2% | 4.1 |
| Cabernet Sauvignon | 3309C | 12 | 8.1 | 7.8% | 3.6 |
| Pinot Noir | 101-14 | 14 | 9.2 | 11.4% | 3.0 |
| Pinot Noir | Riparia Gloire | 14 | 8.9 | 6.1% | 2.8 |
Two seasons of this table and patterns become hard to ignore.
Which metrics most reliably signal that a spray program is actually working?
Percent cluster infection at pre-harvest is the most reliable single metric, because it integrates the entire season's disease pressure and spray performance. [3] It's also the number tied most directly to crop value, since wineries price and discount fruit based on visible disease.
Yield loss rate is the second most reliable. If a block consistently yields 15 percent below its predicted potential based on vine count and cluster weight targets, and disease incidence is elevated, the spray program isn't protecting yield. If yield is on target but disease incidence looks moderate, the variety's skin tolerance may be compensating, which is also useful to know.
Here's what's less reliable than most growers think: spray timing alone, and product cost per acre. A program can be applied perfectly by the calendar and still fail if the canopy architecture on a particular rootstock is preventing coverage. A simple sulfur program timed well can beat a complex low-rate fungicide rotation on a loose-clustered variety with an open canopy.
Cover depth, spray volume per acre, and the product's documented residual efficacy window all matter for reading outcomes. The EPA Worker Protection Standard requires that application records include the pesticide product, the field or block where it was applied, the date, and the amount applied. [5] Those records are also the foundation of any effectiveness analysis, so compliance and tracking reinforce each other here.
How many seasons of data do you need before conclusions are valid?
Two seasons minimum, three is better. One season tells you almost nothing usable because annual weather variation swamps block-level signals.
This isn't just conservative advice. Nobody has great data on the exact minimum season count for statistical confidence in vineyard disease tracking, because the answer depends heavily on disease pressure variability in your specific region and microclimate. What research from the UC Cooperative Extension farm advisor network consistently shows is that growers who act on one-season data (changing programs, switching products, adjusting rates) frequently make changes that the second season's data contradicts. [1]
If you're in a high-pressure region, like the Willamette Valley for Botrytis or the North Coast for powdery mildew, annual variation in infection pressure can be 3x to 4x between a wet spring year and a dry one. A block that looks like a spray failure in a high-pressure year may perform fine in a normal year on the same program.
Three seasons also gives you the chance to see one anomalous year clearly. If seasons one and three show a pattern and season two breaks it, you can tie season two to its weather record and usually find the explanation. That's the point where you can say with reasonable confidence that a particular variety-rootstock combination is underperforming relative to your program.
How do rootstock vigor differences affect spray coverage and penetration?
Rootstock vigor is the most underappreciated variable in spray program evaluation. High-vigor rootstocks like 110R and St. George produce dense canopies that physically block spray penetration to interior clusters. Research from Washington State University's viticulture program found that canopy density measured by leaf layer number directly predicted fungicide coverage on interior clusters, with dense canopies receiving as little as 30 percent of the coverage measured on outer leaves. [4]
That means a block on 110R may genuinely need higher spray volumes, different nozzle configurations, or canopy management (leaf pulling, shoot thinning) before the spray program can deliver consistent protection. If you're evaluating that block on the same criteria as a block on low-vigor 3309C without accounting for canopy density, you'll misread the spray program as ineffective when the canopy architecture is the limiting factor.
The practical fix is to measure canopy density in each block at bloom and again at pre-veraison, and record it alongside your spray data. Then, when you compare disease outcomes across blocks, you can ask: did the high-incidence block also have higher canopy density? If yes, you have a canopy problem, not a spray program failure. If no, you may have a product efficacy or timing problem.
Some rootstock-variety combinations also change the spray interval you need. A more vigorous combination pushes new growth faster, which means fresh, unprotected tissue appears sooner after a spray event. If your program uses a 14-day interval and a high-vigor block is pushing 4 to 6 inches of new growth per week, you may need 10-day intervals on that block alone during rapid growth phases.
What does a practical spray record template look like for block-level tracking?
A functional template for block-level spray tracking has two parts: the spray event log and the assessment log. They link by block ID and date.
Spray event log fields (one row per spray event per block):
- Block ID (include variety and rootstock in the block naming convention, e.g., CabSauv-110R-Block4)
- Date and time of application
- BBCH growth stage
- Product name, EPA registration number
- Application rate (oz or lb per acre)
- Water volume per acre
- Equipment type and nozzle type
- Wind speed at application
- Temperature and relative humidity
- Applicator name (required for WPS records) [5]
- Target pest or disease
Assessment log fields (recorded at bloom, veraison, pre-harvest):
- Block ID
- Date
- Disease or pest assessed
- Number of clusters sampled
- Clusters with incidence (count and percent)
- Severity rating (1-5 scale)
- Canopy density rating or leaf layer count
- Notes (unusual weather, equipment issues, missed blocks)
This is more data than most growers collect today, but less than it sounds. The spray event log takes 5 minutes to fill out per block per event if the form is pre-built. The assessment log takes 20 to 30 minutes per block three times a season. For a ten-block operation, that's under two hours per assessment date.
For growers using paper records, the common UC Cooperative Extension recommendation is to transfer block-level data to a standardized spreadsheet within 48 hours of the field event, because field notes get lost or become illegible faster than you'd expect. [1] Digital entry at the point of application, using a tablet or phone, kills that problem entirely.
How do you adjust spray timing or products when a specific pairing underperforms?
Once your data shows a clear underperformance pattern, the adjustment process is systematic.
First, separate the three possible causes: wrong product, wrong timing, or wrong canopy management. A product can be right for the disease but applied too early or too late in the infection window. Timing can be right but canopy density is blocking coverage. Or the product itself may have limited efficacy on your specific pathogen strain, which is increasingly common with powdery mildew and Botrytis resistance to FRAC Group 3 and Group 7 fungicides. [6]
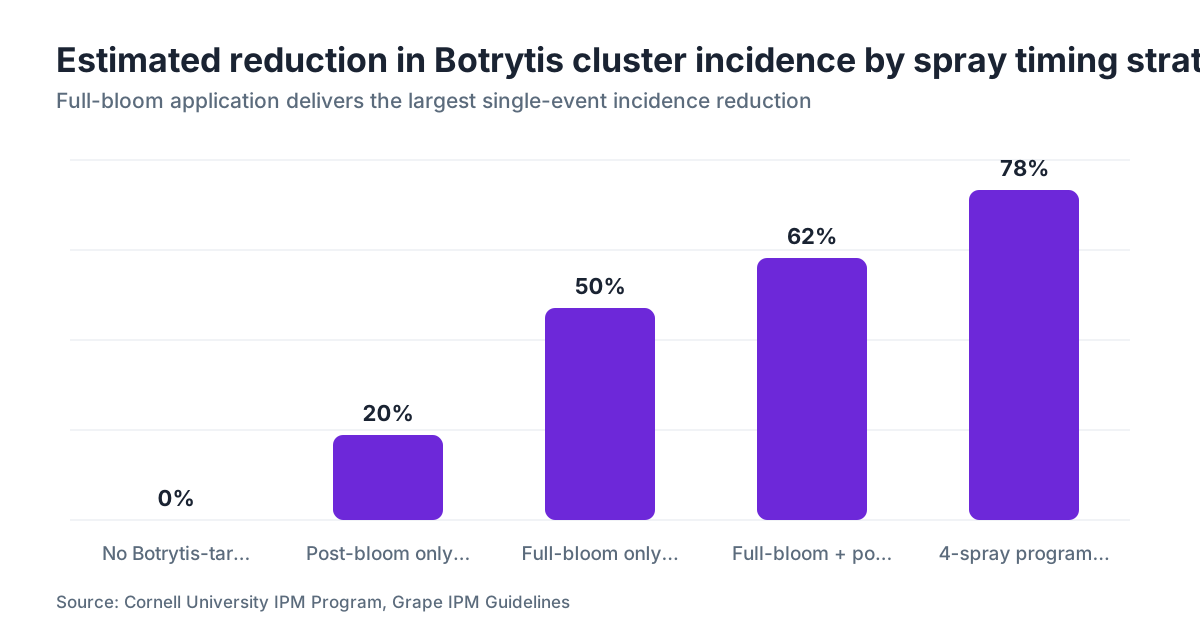
For high-Botrytis-incidence blocks, the most evidence-backed timing change is shifting to a four-spray Botrytis program (early bloom, full bloom, post-bloom, pre-harvest) rather than a two or three-spray program, with the full bloom timing being the highest-priority application. Cornell's Botrytis guidance for cool humid regions specifies that the full-bloom application is the single highest-impact timing, reducing season-end incidence by 40 to 60 percent versus no spray at that timing. [3]
For powdery mildew in high-vigor blocks, the WSU DAS model sets spray intervals based on degree-day accumulation for Erysiphe necator, not the calendar. [4] A block on a high-vigor rootstock that hits the degree-day threshold faster than a neighboring block may genuinely need a shorter spray interval, not a different product.
Change one variable at a time across a minimum of two seasons. If you change the product and the timing at once, you can't know which change drove the outcome difference. Pick the most likely failure point from your data and adjust that alone first.
How do spray records and effectiveness data connect to compliance requirements?
There are two distinct compliance layers that spray records need to satisfy, and block-level data serves both.
The first is federal. The EPA's Worker Protection Standard (WPS) under 40 CFR Part 170 requires that application records include the product name, EPA registration number, the crop and location treated, date, start and end time of the application, and the name of the applicator. [5] These records must be kept for two years. They're the floor, not the ceiling, for a useful tracking system.
The second is state-level. Most states with significant wine grape acreage (California, Washington, Oregon, New York) require pesticide use reports filed with the county agricultural commissioner or state department of agriculture. California's Department of Pesticide Regulation requires a Pesticide Use Report within 30 days of each application for agricultural use. [7] The block ID on your spray record needs to match your DPR reporting geography. If those don't align, you create reconciliation work every reporting period.
Effectiveness data (disease incidence, yield, assessment scores) isn't legally required, but it links your compliance records to your agronomic decisions in a way that protects you. If a neighbor or a regulator asks why a particular product was applied or why application frequency was higher than typical, your assessment records give you a documented answer grounded in field observations rather than opinion.
Keeping compliance records and effectiveness records in the same system, or at least in files that reference the same block IDs and event dates, is a practical requirement if you want the data to be usable. VitiScribe's spray record system is built to satisfy WPS and state-level reporting fields while also capturing the agronomic data needed for effectiveness analysis. You don't have to log the same event twice.
What do extension programs recommend for formal trial design within a working vineyard?
You don't need a randomized controlled trial to get useful effectiveness data from a commercial vineyard. You need what extension researchers call an observational trial with controls, and both UC Davis and Cornell have published practical protocols for this. [1][3]
The core principle is having at least one block in your vineyard serve as an internal reference point each season. This is a block where you apply your standard program consistently, without changes, across the tracking period. Every other block's results are read relative to that reference block's results under the same seasonal weather.
For comparing variety-rootstock combinations specifically, WSU's viticulture extension recommends a minimum of three replicates (three separate vine rows per combination) for any metric you're treating as meaningful data rather than anecdote. [4] In a commercial vineyard, this often means picking the three most representative rows in a block for assessment rather than assessing the whole block, which is a reasonable compromise.
The Cornell IPM program also recommends using a standardized disease pressure index (the Gubler-Thomas Model output for powdery mildew, for example) as a covariate in your comparison, so that you're always comparing disease outcomes relative to the season's infection pressure rather than in absolute terms. [3] This is the difference between saying "Block 4 had 12% incidence" and saying "Block 4 had 12% incidence in a season with 40 high-risk infection periods, versus Block 2's 8% incidence in a season with only 22 high-risk periods." The second comparison is the one that tells you something about program effectiveness.
For growers at vineyards of any scale, these extension protocols translate to plain field habits: walk every block on the same day, use the same visual scale, record weather context, and keep your assessment timing consistent with growth stage rather than calendar date.
How should you handle blocks with mixed or unknown rootstocks?
Many older vineyards have blocks with uncertain or mixed rootstocks, especially those planted before clean nursery records were standard practice. This is more common than the nursery industry would like to admit.
If you have mixed rootstocks within a block, track the block as its own unit but note the uncertainty explicitly in your records. Don't average data from a mixed block into a specific rootstock comparison, because the result will mislead you. Keep those blocks separate in your analysis and label them as "rootstock undetermined."
For blocks where rootstock identity genuinely matters to your analysis, UC Cooperative Extension has published guidance on field identification of common rootstocks using cane diameter, internode length, and node shape characteristics. [1] It's not foolproof, especially where rootstock isn't visually distinguishable at the graft union, but it narrows the field. Tissue sampling for genetic identification is available through some nurseries and university labs if the block size justifies the cost.
The honest answer is that rootstock uncertainty in older blocks is a real limit on the quality of your effectiveness analysis. Acknowledge it in your records. A block labeled "CS-unknown rootstock-Block7" with consistent disease incidence tracking over three seasons still tells you something useful about whether that specific vineyard unit is responding to your spray program, even if you can't place it precisely in a rootstock comparison table.
Frequently asked questions
How often should I assess disease incidence within a growing season?
Three assessments per season is the practical minimum for commercial vineyards: at 50 percent bloom, at veraison, and two weeks before anticipated harvest. Each assessment should sample at least 50 clusters per block for statistically meaningful incidence percentages. If you're tracking a high-pressure disease like Botrytis on a tight-clustered variety, add a fourth assessment at cluster closure, because that's when infection risk rises sharply and your spray timing decision carries the highest impact.
Can I compare spray program effectiveness across different vintages?
Yes, but only if you normalize for disease pressure. Use a weather-based infection model like WSU's Decision Aid System or the UC IPM powdery mildew risk model to assign a seasonal pressure index to each vintage. Without that, you'll confuse a bad spray year with a bad spray program. Two blocks with different incidence rates in a high-pressure year may both be performing correctly relative to the infection risk they faced.
Does rootstock affect how quickly a spray dries and how long it persists?
Rootstock affects canopy density and microclimate, which affects drying time and wash-off risk. A dense-canopied vine on a high-vigor rootstock holds moisture longer after rain or irrigation, which can shorten the residual window of some contact fungicides. This shows up indirectly in canopy management research from WSU, but direct product persistence studies by rootstock are limited. The practical rule is that denser canopies need shorter re-treatment intervals after rain events.
What's the minimum block size that makes per-block tracking worth the effort?
There's no hard rule, but most farm advisors suggest that blocks smaller than one acre produce assessment data too variable for reliable comparison, since a 50-cluster sample from a small block represents a larger share of total clusters and minor assessment errors carry more weight. For blocks under an acre, group them with an adjacent block of the same variety-rootstock combination if one exists, or flag their data as low-confidence in your records.
How do I record a spray event where the sprayer had a mechanical problem mid-block?
Record it exactly as it happened: note the block section covered before the problem, the time the application stopped, and the estimated portion of the block treated. Create a separate event record for the completion application. This matters for effectiveness analysis because a partially-sprayed block with higher disease incidence is a coverage failure, not a product failure. Your records need to capture that distinction. Compliance records (WPS, state reporting) need the same accuracy.
Are there published thresholds for what counts as an acceptable cluster infection rate at harvest?
No single universal threshold exists because tolerance varies by market, contract, and disease. Wineries typically begin discounting loads at 3 to 5 percent visible Botrytis incidence and may reject at 10 to 15 percent, but specific thresholds are negotiated between grower and buyer and aren't set by extension or regulatory bodies. Use your historical contract terms as your practical threshold when evaluating whether a block's spray program protected crop value.
How does the Gubler-Thomas powdery mildew risk model help with spray timing by block?
The Gubler-Thomas model uses daily temperature data to calculate cumulative disease risk, letting you time fungicide applications to actual infection windows rather than calendar intervals. Because different blocks may have slightly different microclimates, you can assign weather station data to each block separately if you have multiple sensors. UC Davis developed the model and the UC IPM program provides free access to the calculation tool. It's useful for comparing spray timing adequacy across blocks in your effectiveness analysis.
Do I need separate spray records for each variety-rootstock block to satisfy California DPR reporting?
California's Pesticide Use Report system requires reporting by section, township, and range geography and by commodity, not by specific block or rootstock. But your internal block-level records need to map to DPR-reportable geographic units. The California DPR recommends keeping internal field records detailed enough to reconstruct the DPR report, which means block-level logs tied to reportable acreage. County agricultural commissioners have local guidance on how to handle sub-block reporting.
What's the best way to track spray effectiveness for grafted vines in their first three years before full production?
Young vines are poor subjects for spray effectiveness analysis because disease incidence relates more to vine establishment stress and training system than to spray program performance. Track spray events and applications for compliance purposes, but keep pre-production blocks out of your effectiveness comparisons. Start using young-vine blocks as data points only after they've reached full canopy development, typically in year three or four depending on rootstock vigor.
How do I account for the difference between contact and systemic fungicide residual periods when comparing blocks?
Log the product's FRAC group and labeled residual window alongside each spray event. When you calculate your per-block cumulative protection days (total days of residual coverage during high-risk periods), use the product-specific window rather than the application interval. A block that received four applications of a 14-day contact fungicide has a different effective protection profile than a block that received four applications of a 21-day systemic product, even with identical spray event counts.
Can I use yield data alone as a proxy for spray program effectiveness?
Yield alone is a poor proxy because it reflects too many other variables: pruning decisions, irrigation, frost, bird pressure, and vine age. A block can have significant disease-related crop loss and still hit a ton-per-acre target if the vine was carrying excess clusters. Yield is a useful supporting metric when combined with cluster weight data, disease incidence scores, and vine-balance indicators like pruning weight. Never use yield as a standalone effectiveness metric.
How do spray coverage maps or drone imagery fit into block-level effectiveness tracking?
NDVI drone imagery can identify within-block variation in canopy vigor and flag stressed zones that correlate with disease pressure or spray coverage gaps. It doesn't measure spray coverage directly, but it helps explain why disease incidence clusters in one corner of a block rather than spreading uniformly. If you're investing in imagery, tie the flight dates to your spray records and assessment dates so the datasets are comparable. Imagery without those reference points is mostly pretty pictures.
Is there a standard way to rate canopy density in the field without specialized equipment?
Point Quadrat Analysis (PQA) is the standard method: insert a thin rod horizontally into the canopy at multiple points per row and count how many leaf contacts it makes. Average contacts per insertion gives a Leaf Layer Number. An LLN under 1.0 is an open canopy, 1.0 to 1.5 is optimal for most disease management, and above 2.0 indicates a canopy that is likely limiting spray penetration. Cornell and WSU extension both describe PQA protocol in their canopy management publications.
How long should I keep spray effectiveness records beyond the compliance minimum?
WPS requires two years, and California DPR requires records for pesticide use reports be kept for their required retention period. For your own effectiveness analysis, keep records indefinitely if storage allows. A five to seven year dataset lets you spot variety-rootstock combinations that perform consistently across both high-pressure and low-pressure vintages, which is far more useful than a two-year snapshot. Digital records cost essentially nothing to store, so there's no practical argument for tossing older agronomic data.
Sources
- University of California Agriculture and Natural Resources (UC Cooperative Extension): UC Cooperative Extension farm advisor network findings on single-season data limitations, canopy management effects on fungicide coverage, and field identification of rootstocks
- UC Davis Department of Viticulture and Enology: Water and nutrient uptake differences between rootstocks affect canopy microclimate, directly shaping Botrytis and powdery mildew risk
- Cornell University Integrated Pest Management Program, Grape IPM Guidelines: Cluster counts of at least 50 per block recommended for statistically useful disease incidence numbers; full bloom Botrytis application reduces season-end incidence by 40 to 60 percent
- Washington State University Viticulture and Enology, Decision Aid System (DAS): Canopy density measured by leaf layer number predicted fungicide coverage on interior clusters, with dense canopies receiving as little as 30 percent of outer-leaf coverage; degree-day accumulation model for powdery mildew spray timing
- US Environmental Protection Agency, Agricultural Worker Protection Standard, 40 CFR Part 170: WPS requires application records include product name, EPA registration number, crop and location treated, date, start and end time, and applicator name, retained for two years
- Fungicide Resistance Action Committee (FRAC), FRAC Code List: Resistance to FRAC Group 3 and Group 7 fungicides is increasingly relevant for powdery mildew and Botrytis management in vineyards
- California Department of Pesticide Regulation, Pesticide Use Reporting Program: California DPR requires a Pesticide Use Report filed within 30 days of each agricultural pesticide application
- UC Statewide IPM Program (UC IPM), Gubler-Thomas Powdery Mildew Risk Index: UC Davis developed the Gubler-Thomas model using daily temperature data to calculate cumulative powdery mildew disease risk for spray timing decisions
- Cornell University College of Agriculture and Life Sciences, Canopy Management Research: Point Quadrat Analysis protocol for measuring canopy density; Leaf Layer Number above 2.0 indicates canopy likely limiting spray penetration
- Washington State University Extension, Viticulture and Enology Program: Minimum of three replicates per variety-rootstock combination recommended for meaningful comparative disease incidence data in commercial vineyard observational trials
Last updated 2026-07-09