Powdery mildew risk model inputs and how to document spray decisions
TL;DR
- Powdery mildew risk models run on three inputs: temperature, relative humidity or leaf wetness duration, and timing since budbreak.
- Document each spray by recording the model score, weather source, product and EPA registration number, rate, block, and applicator.
- That single entry satisfies the EPA Worker Protection Standard's two-year record rule and most state pesticide reporting at once.
What inputs does a powdery mildew risk model actually need?
Three inputs drive every powdery mildew risk model: temperature, relative humidity or leaf wetness duration, and calendar timing relative to budbreak. That's the whole engine. Fancy interfaces just dress it up.
The UC Davis model, built by Doug Gubler and David Thomas and now called the UC Risk Assessment Model, assigns a daily index of 0, 1, or 2 based on how many hours the temperature holds between 70°F and 85°F (21°C to 29°C) during a wetting event [1]. Six or more hours in that band on back-to-back days pushes the cumulative index toward 30 and above, which is the number that triggers a protective spray. Below 50°F or above 95°F, the fungus quits. That temperature pair is one of the most useful numbers in California viticulture.
Cornell's forecasting tools, delivered through the Network for Environment and Weather Applications (NEWA), use degree-days from budbreak plus ascospore maturity estimates tied to spring rainfall. NEWA tracks primary infection from overwintering chasmothecia separately from the secondary conidia cycle [2]. That split matters. Your early-season spray timing runs on completely different biology than your midsummer timing.
WSU's Decision Aid System (DAS), used across the Pacific Northwest, adds a third input: the density of overwintering inoculum, estimated from your vineyard's history and last season's severity scoring [3]. Heavy mildew in a block last year means the baseline index for that block starts higher this spring. You enter that judgment by hand. No weather station knows what happened in your vineyard last fall.
For any model to give you output you can defend, the weather data has to come from a station close enough to your vines to mean something. UC Cooperative Extension advisors generally say within 1 to 2 miles at the same elevation band, because temperature inversions in coastal valleys create 8°F to 12°F swings over short distances. A regional airport ASOS station two ridges away beats nothing, but it's a real source of error. Running several blocks with different aspect and canopy density? Ask yourself whether one station honestly represents all of them.
How do temperature and humidity interact in the infection period calculation?
Temperature sets the speed. Moisture opens the gate. Spores of Erysiphe necator, the grapevine powdery mildew pathogen, germinate in as little as 60 to 70 percent relative humidity, which is low for a fungus. Most fungal diseases need free water. This one doesn't. That's why dew, overhead irrigation, and fog all count as infection triggers with no rain in sight [1].
The infection clock starts when RH climbs past roughly 40 to 50 percent and temperatures sit in the susceptible range. Duration is what the model banks. A 4-hour event at 75°F carries less weight than an 8-hour event at the same temperature. The Gubler-Thomas model turns that duration-and-temperature combination into a risk index increment, so you get one number you can plot across the season.
Time of day matters more than most growers think. Sporulation peaks in the late afternoon, and spore release runs highest when it's warm with moderate humidity, not during rain. Morning irrigation that wets leaves from 6 a.m. to 9 a.m., with temps still under 65°F, adds far less pressure than the same leaf wetness on a warm afternoon. If you're reading raw logger data instead of a processed model, hold that thought while you eyeball the numbers.
One thing trips up growers who move between regions. The Gubler-Thomas model was calibrated for California coastal and inland valley conditions. WSU and Cornell researchers report that local validation sometimes shows different optimal temperature ranges, especially for Pacific Northwest strains [3]. The core biology holds. The threshold boundaries shift a little. Using a model outside its calibration region, the output is still directionally right, so treat it as a guide, not a hard trigger.
What is a risk index score and when should you spray?
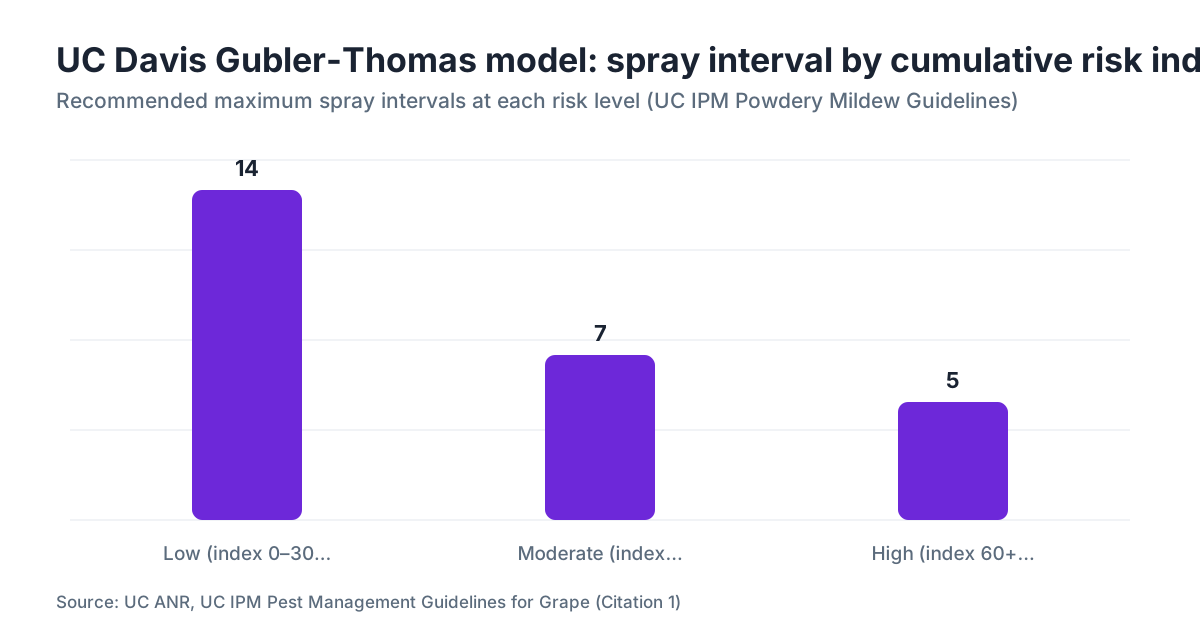
The UC Davis model outputs a cumulative risk index. Days with 6 or more hours in the 70°F to 85°F range add 2 points; 3 to 5 hours add 1; under 3 hours or outside the window adds nothing [1]. The recommended spray thresholds:
| Cumulative Index | Risk Level | Recommended Interval |
|---|---|---|
| 0 to 30 | Low | 14-day intervals or less |
| 31 to 60 | Moderate | 7-day intervals |
| 60+ | High | 5-to-7-day intervals, highest efficacy materials |
Those bands come from UC ANR viticulture and enology extension publications and have been cited since the late 1990s. They're still the most-used thresholds in California. Cornell and WSU run different scoring scales but land in about the same practical spot: after several consecutive infection periods, shorten the interval and consider a more protective fungicide class.
The index misses one big thing, and that's canopy density. A tight, high-vigor canopy in a wet spring is almost always more dangerous than the weather station suggests. Spray penetration drops, the microclimate inside the canopy stays humid longer than the external RH sensor reads, and inoculum builds faster. Add a mental penalty for dense canopies and tighten your interval. Nobody has built a widely available model that fully accounts for within-canopy microclimate. The closest work sits in research plots at Cornell and Davis, not in commercial tools yet.
How do you record which model inputs drove a spray decision?
A spray record that satisfies both good agronomy and regulators captures five things at the moment you decide: the date and weather data or model score that justified the application, the product name with EPA registration number and rate, the target pest and crop, the applicator name and license number if required, and the block identifier with treated acreage [4].
Most growers already track items two through five, because state ag departments and the EPA Worker Protection Standard demand them. The one that slips is the first item, the decision rationale. A regulator reviewing your file doesn't need the full model printout. You just need to show why you sprayed that day. A single line reading "Risk index: 45, moderate; day 7 of current interval" takes 30 seconds to write and closes the question.
Blocks under a formal IPM or certified sustainable program (LODI Rules, SIP Certified) often require the decision basis on the record itself. CCOF and some Demeter-certified operators hold similar expectations for approved inputs. Pull your program's audit checklist, because the bar moves from program to program.
The EPA Worker Protection Standard (40 CFR Part 170), revised in 2015 and effective in 2017, requires that application records be kept for two years and be available to designated representatives on request [4]. The WPS doesn't specifically require model inputs, but recording them costs you nothing and covers you if a decision ever gets questioned by a neighbor, a buyer's audit, or a state inspector. Field notebooks work. A spreadsheet works. A platform like VitiScribe lets you log the model score in the same entry as the product record, so it's searchable later without digging through two systems.
One format that covers your bases:
| Field | What to record |
|---|---|
| Date of decision | The day you decided to spray, not always the application day |
| Weather trigger | Model score, or raw data (e.g., "8 hrs RH > 70%, temps 72 to 79°F") |
| Product + Reg. No. | Label name, EPA Reg. No., formulation |
| Rate | Per acre, per 100 gal, or per label unit |
| Block/acres treated | Block name, GPS polygon if available |
| Applicator | Name and certification number |
| Re-entry interval | From the label, with the date and time entry is permitted |
What weather station setup gives you the most reliable model inputs?
A datalogger recording air temperature, relative humidity, and leaf wetness at 15-minute intervals is the floor for running a processed risk model. Most growers pick either a dedicated on-site station (Onset HOBO, Davis Instruments, Pessl METOS, Spectrum Technologies) or a subscription to a regional network like CIMIS in California [5], AgWeatherNet in Washington [3], or the New York State Mesonet feeding NEWA in the Northeast [2].
Leaf wetness sensors earn the extra cost. An RH sensor tells you the humidity around the canopy. A leaf wetness sensor, which is a painted circuit board that mimics a leaf surface, tells you whether the canopy is actually wet. The two split often, especially during fog and heavy dew, and models calibrated with leaf wetness data give you clearly better output than RH-only inputs.
Placement matters. Mount sensors at canopy height in the vine row, not on a post out in the drive row at 6 feet. Canopy height is where the disease lives. If your station follows a regional network standard (CIMIS mounts at 2 meters), know that the reading will systematically underread the wetness duration inside a dense fruiting zone.
Data quality over time is its own problem. Leaf wetness sensors degrade. The coating wears, the calibration drifts, and you end up with a sensor that reads wet all the time or dry all the time with no obvious failure signal. Put sensor inspection on the spring startup checklist, right next to sprayer calibration.
How do university extension models differ from each other and which one fits your region?
Three university systems run most U.S. commercial viticulture: UC Davis (Gubler-Thomas), Cornell/NEWA, and WSU DAS. Same core biology, different handling of inoculum pressure, regional calibration, and interface.
The UC Davis model is the most referenced across California and warm interior regions. It's temperature-and-duration-focused and was validated mostly in Napa, Sonoma, and the San Joaquin Valley [1]. UC ANR publishes the parameters in plain extension bulletins, so you can run it in a spreadsheet without any software.
Cornell's NEWA platform is the standard for New York, Pennsylvania, and the Northeast. It folds in ascospore maturity, which genuinely helps because your first spring spray should key off primary inoculum release, not secondary cycle pressure [2]. The NEWA interface pulls from local station networks and produces a calendar-view risk chart most growers read easily.
WSU's Decision Aid System focuses on the Pacific Northwest and treats inoculum density from your own vineyard history as an adjustable parameter [3]. Farming eastern Washington or Oregon, DAS is calibrated for your conditions in ways the other two aren't.
Farming a region that doesn't slot neatly into one of the three (Texas Hill Country, say, or the Finger Lakes border zone)? Start with the model closest to your climate type and cross-check it against local extension advice. UC Cooperative Extension farm advisors publish county-specific mildew newsletters through the growing season, often with model output for regional stations, which makes a good ground-truth check on whatever you're running.
Before you settle on one model, walk a vineyard in your region and talk to whoever farms it. Knowing what actually triggers disease in a specific microclimate beats any model output.
What do EPA and state regulations actually require in your pesticide records?
The EPA Worker Protection Standard at 40 CFR Part 170 requires that pesticide application records include the product name, EPA registration number, active ingredient, location of the application, date applied, amount applied, and the name of the certified applicator [4]. You keep those records for two years from the application date.
The rule requires that records be "kept for two years after the date of each pesticide application and must be provided to EPA, state, or tribal lead agencies upon request." That's the regulation's own language. Your state department of agriculture layers on more, and in most states the state rules run stricter than the federal floor.
California holds some of the most demanding pesticide recordkeeping rules in the country. Under California Food and Agriculture Code sections 11501 and following, licensed pest control advisers must file written recommendations, and operators must submit monthly pesticide use reports to their county agricultural commissioner [6]. Those reports flow into the statewide Pesticide Use Reporting database maintained by CDPR. The database is public, which means your spray program is visible to researchers, neighbors, and buyers.
New York requires private applicators to keep records for three years [2]. Washington requires commercial applicator records for two years and may require extra reporting for restricted-use products depending on the label [3]. Applying sulfur, copper, or a synthetic fungicide under a supplemental label? Read that label. Supplemental labels sometimes carry recordkeeping language of their own.
One more worth knowing: the re-entry interval (REI) on the label is a WPS compliance item that belongs in your spray record. If the REI is 24 hours and a crew walks in at hour 12, that's a violation. Recording the REI at spray time gives you and your crew the documentation to confirm when field entry is allowed.
How do you document spray decisions for an IPM or sustainability audit?
IPM and sustainability certifications ask for a layer beyond basic compliance. LODI Rules for Sustainable Winegrowing, the California Sustainable Winegrowing Alliance (CSWA), and SIP Certified all want you to show why you sprayed, and specifically that you weighed non-chemical options first [7].
For a LODI audit, your record should carry the trigger (model score, scouted symptom level, or calendar date with justification), the alternatives you considered, and why you chose the product. A one-line note like "Model index 42, moderate risk, chose wettable sulfur as lowest-risk effective option, canopy still manageable" takes under a minute and fully meets the program's standard.
Organic certification (CCOF, OMRI) goes further. You have to show that every input comes from the approved materials list and that your rationale matches an organic system plan reviewed by your certifier. Sulfur is the backbone of organic mildew programs, but some formulations, particularly certain wettable sulfurs, carry processing aids that aren't OMRI-listed. Check before you spray and document which formulation you used.
More wineries buying fruit now ask for spray records as part of the grower contract, and a handful of large buyers run formal grower audits that mirror CSWA or LODI standards. Keeping clean, model-referenced records from the start means you rebuild nothing when the audit notice lands. The number of buyers asking for this rises year over year.
What's the minimum viable spray record format that covers all requirements?
You can build a compliant spray record on a paper log or a spreadsheet. The columns you need: date of decision, date of application (they can differ), block or field ID, target pest, product name, EPA registration number, active ingredient, rate per label unit, total amount applied, total acres treated, applicator name and certification number, REI, and decision rationale.
Want to go further without much added time? Add two columns: weather station ID or source, and the model score or raw weather data that triggered the decision. Those two turn a regulatory record into a management tool. At season's end, lay your cumulative index chart next to your spray dates and see whether your timing tracked risk or whether you were trailing or leading the pressure.
A tool like VitiScribe pulls weather data alongside your spray entries automatically, which trims the manual data entry for that model score column. A well-built spreadsheet does the same job if you're disciplined about filling it the day of the decision, not two weeks later.
One trap to skip: logs filled in after the fact from memory. Agencies know what reconstructed records look like. The dates come out round, the rates always land exactly on-label, and the weather notes read suspiciously consistent. Fill records the day of the decision. It's faster in the moment, and it holds up.
What are common mistakes growers make when using risk models?
The most common mistake is running one weather station that doesn't represent the block. Growers plant a station in a convenient spot, near the shop or on a high point, then run the model for every block off that single reading. A north-facing block in a fog channel two hundred meters away carries meaningfully different humidity duration than the station, and the output is wrong for that block.
Second most common: ignoring the cumulative index and resetting it after every spray. The model is cumulative on purpose, because inoculum doesn't vanish when you spray. The application knocks down the active population, but if you logged moderate-to-high index days beforehand, the background pressure stays elevated. Treat the index as a running account of environmental pressure, not a scorecard that zeroes out.
Third: leaning on the model as the only input while ignoring what's in front of you. Powdery mildew shows clear visual symptoms. If you're scouting regularly and seeing fresh colonies, the index matters less than the fact that disease is present and spreading. At that point you're managing an established infection, not preventing one, and your fungicide choices shift toward curative modes of action.
Fourth, and specific to paperwork: using trade names only, with no EPA registration number. The Reg. No. is the identifier that ties back to the specific label you're legally bound to follow. Apply at a rate or in a manner off-label, and that number is what links the record to the obligation. Write it down every time.
How should you handle spray decisions during a high-pressure season or after you've already seen symptoms?
Once you've got visible mildew in the vineyard, the model drops to a secondary tool. Your primary trigger is the observed disease level and spread rate, and your documentation should say so. Write down what you saw, when you saw it, what percentage of shoot tips or clusters were hit, and in which blocks. That scouting note becomes the legal and agronomic justification for moving to a curative or kick-back fungicide.
For resistance management in a high-pressure season, UC, Cornell, and WSU all say to rotate mode-of-action groups by FRAC code. If you've run a Group 3 (DMI, like myclobutanil or tebuconazole) twice in a row and disease keeps spreading, that's the signal to shift to Group 11 (QoI/strobilurin) or Group 7 (SDHI). Document the rotation in your spray record. If a resistance problem shows up later and you need to reconstruct the program for a PCA review or a state investigator, the rotation history is the most relevant thing in your file.
Timing inside a high-pressure window matters a lot. UC Davis research shows protective applications made before or during an infection period are far more effective than curative applications 3 to 4 days after [8]. The practical read: if your index is climbing and you're already at day 6 of a 7-day interval, go at day 6. The record just needs to note the reasoning.
After the season, sit down with your spray record and your model log together. Count the applications, average your risk index on spray days, and check whether your intervals tracked the threshold bands. That review takes about an hour and tells you more about your program's efficiency than anything else.
Frequently asked questions
What temperature range does powdery mildew need to cause an infection period?
Erysiphe necator grows most aggressively between 70°F and 85°F (21°C to 29°C). Below 50°F growth essentially stops, and above 95°F heat suppresses the fungus. The UC Davis Gubler-Thomas model counts hours inside the 70°F to 85°F window during a moisture event to set the daily risk index, with 6 or more hours adding the maximum 2 points to the cumulative index.
How many years do I need to keep pesticide application records?
The EPA Worker Protection Standard requires two years from the application date. Some states run stricter: New York requires three years for private applicators, and California requires operators to file monthly pesticide use reports with their county agricultural commissioner, archived in the statewide CDPR database. Check your state department of agriculture for the retention period that applies to you.
Can I use a nearby CIMIS or airport weather station instead of an on-site sensor?
You can, but the farther the station and the more terrain between it and your vines, the more error you add. UC Cooperative Extension advisors recommend a station within 1 to 2 miles at the same elevation band. Regional networks like CIMIS, AgWeatherNet, and NEWA make useful baselines, but an on-site sensor at canopy height gives more accurate model inputs, especially leaf wetness duration.
What is the difference between a protective and a curative fungicide application, and does it affect my records?
A protective application goes on before or during an infection period to stop spore germination. A curative application goes on after infection to halt colony development, using groups like DMIs or QoIs that have back-action. Note which type you're making, because it drives your fungicide choice, timing justification, and rotation. Regulators don't require the distinction, but certifiers and PCA reviews often do.
Does the EPA Worker Protection Standard require me to document the reason I sprayed?
No. The WPS (40 CFR Part 170) doesn't require decision rationale in the mandatory fields. It requires product name, EPA registration number, active ingredient, location, date, amount applied, and certified applicator name. Decision rationale is an IPM and sustainability certification requirement, not a federal baseline. It still takes seconds to record and protects you in buyer audits and state inspections.
What FRAC codes should I rotate through for powdery mildew management?
The main groups on grapevine powdery mildew are Group 3 (DMIs: myclobutanil, tebuconazole), Group 7 (SDHIs), Group 11 (QoIs/strobilurins: azoxystrobin, trifloxystrobin), Group U6 (quinoxyfen), and Group M2 (inorganic sulfur). UC Davis, Cornell, and WSU all say to avoid more than two consecutive applications of the same FRAC group. Record the FRAC code alongside the product name in your log.
How does California's pesticide use reporting work for vineyard fungicide applications?
California growers file monthly pesticide use reports with their county agricultural commissioner under California Food and Agriculture Code sections 11501 and following. Those reports aggregate into the CDPR statewide Pesticide Use Reporting database, which is public. Late reporting is a violation subject to civil penalties. A licensed pest control adviser must issue a written recommendation for any restricted-use pesticide application in California before you apply.
What should I record when I decide NOT to spray after reviewing the risk model?
Record the model score and why you held. A note like "Index 18, low risk, no spray, next review in 7 days" takes 10 seconds and builds a documented IPM decision trail, showing you're monitoring and making reasoned choices rather than calendar spraying. For LODI Rules or CSWA audits, no-spray decisions with rationale count as much as spray decisions in showing an IPM-based approach.
Can I use a spreadsheet for spray records or do I need dedicated software?
A spreadsheet is fully compliant with EPA WPS requirements and most state rules, as long as it captures every required field and you keep it for the required period. Dedicated vineyard software mainly adds searchability, weather data integration, and audit-ready exports. Managing more than one block or farming over 20 acres, the time savings from integrated systems get real. Under 20 acres, a good spreadsheet is fine.
What scouting data should accompany my risk model outputs in the spray record?
At minimum, record the percentage of shoots or clusters showing symptoms in each block, the scouting date, and who walked it. Using a formal rating scale (0 to 5 severity, percent incidence)? Record the scale and score it consistently so you can track progression through the season. Scouting notes showing zero symptoms next to a low model score are strong evidence of an effective preventive program if records ever get reviewed.
How do I document spray decisions for organic certification?
Your records need to show every material applied appears on your organic system plan and is OMRI-listed or otherwise approved by your certifier. Record the OMRI listing number or certifier approval reference alongside the standard fields. Using sulfur, note the specific formulation, because some processing aids aren't approved. Keep the product label and the OMRI listing confirmation on file with the spray record each season.
Is the Gubler-Thomas model the same as the UC Davis risk assessment model?
Yes. Gubler-Thomas is the original academic name, after Doug Gubler and David Thomas who developed it at UC Davis. It's the same risk index system published through UC ANR extension and referenced in UC IPM guidelines. The 0-to-2-points-per-day scoring, the 70°F to 85°F window, and the 0/30/60 threshold bands all come from that source. Some vendors call it the "UC powdery mildew model" in their software.
What happens if my spray record is missing required information during a WPS inspection?
WPS inspections usually run through state departments of agriculture acting as EPA enforcement partners. Missing or incomplete records are a civil violation. Penalties vary by state and severity, but fines starting at several hundred dollars per violation per day are common. Beyond fines, incomplete records during a buyer audit or certification review can trigger failed findings, which carry commercial consequences that often top the regulatory penalty.
Sources
- UC ANR, Grape: Powdery Mildew, UC IPM Pest Management Guidelines: UC Davis Gubler-Thomas model: risk index 0-2 per day based on hours between 70°F and 85°F; cumulative thresholds at 0, 30, and 60 for spray interval guidance
- Cornell University, Network for Environment and Weather Applications (NEWA): Cornell NEWA platform provides grapevine disease forecasting including powdery mildew models with ascospore maturity inputs for northeastern U.S. growers
- Washington State University Extension, Viticulture and Enology, Pest Management Resources: WSU Decision Aid System (DAS) for Pacific Northwest viticulture incorporates overwintering inoculum density and vineyard history in powdery mildew risk assessment
- U.S. EPA, Worker Protection Standard, 40 CFR Part 170: EPA WPS requires pesticide application records be kept for two years and be available upon request; mandated fields include product name, EPA reg. number, active ingredient, location, date, amount, and certified applicator name
- California Dept. of Water Resources, California Irrigation Management Information System (CIMIS): CIMIS provides ag weather station data including temperature and relative humidity used as inputs for UC Davis powdery mildew risk models in California
- California Department of Pesticide Regulation, Pesticide Use Reporting: California growers must submit monthly pesticide use reports to county agricultural commissioners under California Food and Agriculture Code sections 11501 et seq.; data is aggregated into the statewide PUR database
- California Sustainable Winegrowing Alliance (CSWA), Certified California Sustainable Winegrowing: CSWA and comparable programs require documentation of pest management decisions including consideration of non-chemical alternatives before treatment
- UC Davis Viticulture and Enology, Powdery Mildew Management Publications: UC Davis research shows protective fungicide applications made before or during infection periods are significantly more effective than curative applications made 3-4 days after infection
- Fungicide Resistance Action Committee (FRAC), FRAC Code List: FRAC codes for powdery mildew fungicide groups: Group 3 (DMIs), Group 7 (SDHIs), Group 11 (QoIs/strobilurins), Group U6 (quinoxyfen), Group M2 (inorganic sulfur)
- Organic Materials Review Institute (OMRI), Products List: OMRI listing confirms whether specific sulfur formulations and other fungicide products are approved for use in certified organic vineyard programs
Last updated 2026-07-09