Gubler-Thomas powdery mildew risk index calculation for grapes
TL;DR
- The Gubler-Thomas index counts days when the daily average temperature lands between 70 and 85°F, adding 20 points per qualifying day.
- Three straight days in that range push the score to 60, the high-risk trigger for 7-day spray intervals.
- Scores below 30 are low risk; 30 to 59 are moderate.
- It tells you when to spray, not whether disease is already there.
What is the Gubler-Thomas powdery mildew risk index and why does it matter?
The Gubler-Thomas Powdery Mildew Risk Index is a temperature-based forecasting model built at UC Davis by plant pathologist Doug Gubler and his colleague Mark Thomas in the mid-1990s. It targets one organism: Erysiphe necator (formerly Uncinula necator), the fungus behind grape powdery mildew. It's the most widely used mildew forecasting tool in California viticulture, and it keeps spreading across the western states. [1]
The core idea is simple. The fungus grows fastest, throws off the most conidia, and infects hardest when daytime temperatures sit between 70°F and 85°F (21 to 29°C). Below 50°F it goes essentially dormant. Above 95°F the heat kills spores and stalls colony expansion. [2]
Why does that matter on the ground? Without a risk index, most growers fall back on calendar spraying. That means wasted applications during cool or hot stretches, or coverage gaps during a high-risk window that looked harmless on the calendar. The index hands you a number to act on instead of a hunch.
How is the Gubler-Thomas risk index actually calculated?
The math runs off daily average temperature, which is just (daily max + daily min) / 2. You count how many days land in the optimal growth range and add points accordingly. That's the whole engine.
Here's how the scoring works [1][2]:
| Daily Average Temp | Points Added Per Day |
|---|---|
| Below 50°F (10°C) | Index resets to 0 |
| 50-69°F (10-20.5°C) | 0 (no accumulation) |
| 70-85°F (21-29.5°C) | +20 |
| 86-94°F (30-34.5°C) | 0 (no accumulation, but index holds) |
| 95°F+ (35°C+) | Index resets to 0 |
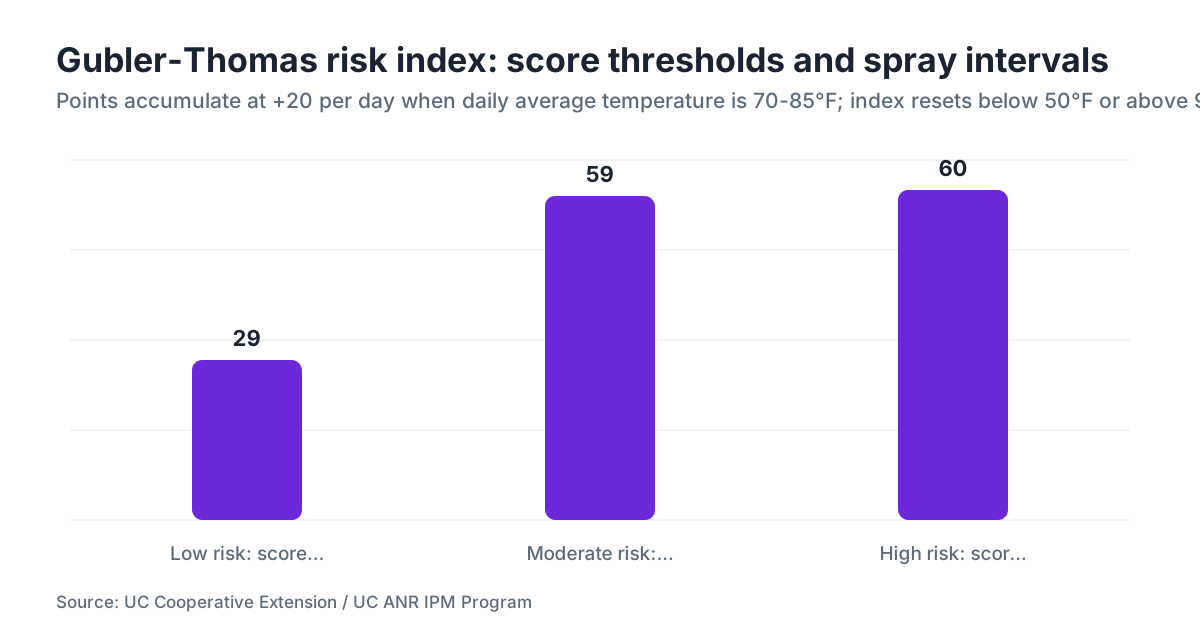
Once enough points stack up across days, the index crosses one of three thresholds:
| Score | Risk Level | Recommended Spray Interval |
|---|---|---|
| 0-29 | Low | Every 21 days or longer |
| 30-59 | Moderate | Every 14 days |
| 60+ | High | Every 7 days |
A score of 60 arrives after three consecutive days with the daily average parked in the 70-85°F band. That's the trigger most growers watch for. [1]
The index doesn't count fractional degrees. It's a discrete daily check. Say Tuesday averages 72°F, Wednesday drops to 68°F, and Thursday hits 74°F. Only Tuesday and Thursday add +20 each. Wednesday breaks the accumulation streak but does not reset anything (a reset only fires when temps fall below 50°F or climb above 95°F). The index holds at its current value through the quiet days until it either resets or keeps climbing.
What temperature thresholds trigger each risk level?
The three levels map to real field conditions and to research on how fast conidia germinate.
At low risk (score 0-29), the fungus is around but growing slowly. Germination rates fall off hard below 70°F. A study summarized by UC Cooperative Extension found germination drops from roughly 70% at 70°F to under 20% at 50°F. [3] You still need coverage during low-risk stretches if your region carries heavy inoculum, but stretching to a 21-day interval is defensible.
Moderate risk (30-59) means you've had one or two days in the prime band. Infections can start, but colony expansion hasn't peaked. Fourteen-day intervals keep pace with disease development most of the time.
High risk (60+) is where calendar sprayers get burned. Three straight days of 70-85°F averages give conidia the conditions to germinate quickly, colonies to expand fast, and berry infections to take hold before you see a thing. Seven-day intervals are the UC Davis guidance, and plenty of growers in high-pressure regions drop to six days when temperatures hold in the mid-70s for a long run. [1]
One caution: the 95°F reset is real, but don't trust it blindly. In coastal and valley blocks, temperatures can spike above 95°F for a day or two and then slide right back into the 70s. The score resets. The surface inoculum on your leaves and clusters does not. Treat that reset as a pause, not a clean slate.
Does rain or dew affect the Gubler-Thomas index calculation?
No. The standard Gubler-Thomas model is temperature only. It does not fold rainfall, leaf wetness duration, or relative humidity into the score. [1][2] This trips up a lot of growers who came from other disease models.
The reason is the biology. Unlike most fungal pathogens, E. necator doesn't need free water to germinate or infect. Conidia can germinate and infect at relative humidity as low as 40%, and rain can actually rinse spores off leaf surfaces, cutting inoculum for a while. That's the opposite of downy mildew or botrytis, where wetness duration drives everything.
Rain still matters indirectly. Heavy rain after a dry spell tends to flush inoculum, and some growers use a big rain event as a cue to reassess pressure before they change the spray program. UC Cooperative Extension advisors in Napa and Sonoma have noted that wet winters followed by warm springs build high inoculum loads going into the season, so the same index score carries more real risk in those years.
Some modern versions of the model, the kind baked into weather station software and regional decision tools, do read leaf wetness sensors and flag conditions for other pathogens alongside the mildew score. The Gubler-Thomas calculation itself stays temperature driven.
How do you set up a weather station to track the index in your vineyard?
You need a station that logs, at minimum, daily maximum temperature and daily minimum temperature. Hourly temperature helps, because it lets you check your daily averages. A station at canopy height, roughly 3 to 4 feet above the ground inside a vine row, reads more accurately than one on a post at the vineyard edge. [4]
The UC Davis group built the original model around CIMIS (California Irrigation Management Information System) data, which comes off sensors mounted 6 feet up. [5] If you're pulling from a regional CIMIS station instead of your own, know that your vineyard microclimate can run several degrees off, especially in low blocks where cold air pools or on south-facing slopes that heat early.
The calculation costs you nothing. A spreadsheet does it: one column for date, one for daily max, one for daily min, one for daily average, one for points earned (0 or 20), one for the running total with reset logic when the average drops below 50 or tops 95. Some growers keep it in a paper notebook. It takes about two minutes a day once the data feed is set.
Want it automated? UC ANR IPM tools, NEWA (Network for Environment and Weather Applications from Cornell), and private weather services publish pre-calculated Gubler-Thomas outputs for their station networks. [6][7] Confirm the tool is running the real Gubler-Thomas calculation and not a tweaked version with different thresholds. Variations are out there.
Running multiple blocks with different microclimates? Keep a separate index per block. A valley-floor block and a hillside block a quarter mile apart can land in different risk categories on the same day.
When in the season should you start running the index?
Start at bud burst. E. necator overwinters as chasmothecia (formerly cleistothecia) in bark and as mycelium inside infected buds. Primary infections from ascospore release usually begin around 10 to 50% shoot emergence and run through bloom. [2]
Growers sometimes wait until they see green tissue before they start tracking. By then, primary infections may already be set and invisible. The window that matters most runs from about 1-inch shoot growth through fruit set, which is also when berries are most open to infection. Berries lose most of their susceptibility roughly three to four weeks after bloom, when the cuticle thickens, though the disease can still colonize rachises and wreck clusters later. [2][3]
Stop treating the index as a live spray timer once harvest wraps and you've decided about a post-harvest protectant. Some growers in high-pressure regions put down one post-harvest application to knock back overwintering inoculum. Whether that pays off, against the cost and the EPA Worker Protection Standard re-entry obligations, depends on how hard you got hit during the season. [8]
How do you choose the right fungicide based on the risk level?
The index tells you how often to spray. Your fungicide choice decides how well the spray works. Two separate calls, but they lean on each other.
At low risk, sulfur is the workhorse. It's cheap, it works when temperatures are above 65°F at application, it has a broad label, and resistance isn't a real concern. The catch: don't apply sulfur within 14 days of an oil application, and skip it when temperatures will top 90°F within 24 hours, because phytotoxicity risk climbs fast. [3]
At moderate and high risk, reach for sterol-inhibitor fungicides (DMI group, FRAC code 3), the newer succinate dehydrogenase inhibitors (SDHI group, FRAC code 7), or combinations. UC Davis resistance monitoring has documented reduced sensitivity to some DMI fungicides in California E. necator populations, so rotate FRAC codes and don't lean on one chemistry for the whole program. [11]
At high risk during bloom and fruit set, protectant intervals matter most, because you're defending against infections that only show up weeks later. UC Cooperative Extension guidance recommends your most effective systemic materials in this window rather than leaning on protectants like sulfur alone. [1]
Check the specific label for pre-harvest interval and re-entry interval requirements under the EPA Worker Protection Standard (WPS). The standard at 40 CFR Part 170 states that workers may not enter a treated area before the label re-entry interval (REI) has expired, and the handler and grower carry specific notification duties. [8] Some SDHIs carry 4-hour REIs; sulfur is typically 24 hours. Record these intervals in your spray log. They're the basis of a compliance inspection.
If you run operations across several sites or fight to keep FRAC rotation straight across a season, spray record software catches conflicts a paper log buries. VitiScribe is one tool that ties spray records to weather data and flags re-entry intervals, which cuts the paperwork load during heavy spray weeks.
What are the known limitations of the Gubler-Thomas model?
No model is perfect. Here's where Gubler-Thomas can steer you wrong if you follow it on autopilot.
First, it assumes inoculum is present. Grow in a region with little disease history, or hit a cool year where overwintering chasmothecia produced few viable ascospores, and a high-risk score still won't mean the same infection rate as a high-pressure situation. The model is blind to inoculum load.
Second, it was built mostly on California data from the Central Valley and North Coast. Growers in Washington, Oregon, New York, and elsewhere find it useful but flag that local calibration matters. Washington State University Extension and Cornell's NEWA program both reference the model while noting that regional tuning is still in progress. [6][7]
Third, microclimate variation is real. One weather station reading can miss temperature inversions, fog, and shading that shift the true index in a specific block.
Fourth, it ignores canopy density. A dense canopy with poor airflow builds a friendlier microenvironment for the fungus than the ambient temperature implies. Growers who do aggressive shoot positioning and fruit-zone leaf removal consistently report less disease at the same index score than less-managed blocks. Canopy work and spray timing are complementary tools, not substitutes.
Finally, nobody has clean data on how the model performs across every variety. Anecdotally, highly susceptible varieties like Chardonnay and Cabernet Sauvignon deserve tighter intervals at moderate risk than resistant ones. UC Davis powdery mildew risk work acknowledges varietal differences, but the index itself doesn't adjust for them. [1]
How does the Gubler-Thomas index compare to other powdery mildew forecasting models?
A few other models are worth knowing.
The UC IPM model is essentially the Gubler-Thomas model served through the UC IPM online interface, so there's no real daylight between them. [9]
The Powdery Mildew Risk Assessment (PMRA) out of New York, developed partly through Cornell and the NEWA network, folds both temperature and relative humidity into a combined index. Some New York growers find it more responsive to their cooler, wetter seasons. [7]
European systems in France and Germany often build around spore-trapping data paired with weather, which gives them the inoculum awareness Gubler-Thomas lacks. The trade-off is cost and complexity. You need physical spore traps and regular lab analysis.
For most California growers and a big share of Pacific Northwest operations, Gubler-Thomas is the practical pick. It's well documented, well calibrated for western conditions, needs no lab work, and the spray-interval guidance is directly actionable. Cornell and WSU extension both recommend it as a starting point even in their regions. [6][7]
One distinction matters. The Gubler-Thomas index is a decision-support tool, not a regulatory standard. Your state department of agriculture and your pesticide use reporting rules don't care which model you run. They care that you applied registered materials at legal rates and kept accurate records.
How do spray records and compliance documentation connect to the index?
This is where the agronomy meets the regulator. California, Washington, Oregon, and most other major grape states require pesticide use reports (PURs) for agricultural applications. In California, county agricultural commissioners require reports on a monthly schedule, and the data has to include application date, product, rate, acres treated, and operator information. [10]
If the index drives your spray decisions, log the index score on the day you decide to spray and attach it to the spray record. It builds a defensible rationale for your timing if anyone questions your spray frequency, and it's genuinely useful when you review the season to see whether the program tracked actual risk.
For EPA WPS compliance, every application that carries a re-entry interval has to be logged, and workers have to be notified through central posting or an equivalent. [8] Run a 7-day interval during a high-risk stretch and you may have workers re-entering blocks still under an active REI from the last application. That's an easy compliance mistake to make mid-season when everyone's moving fast.
Keep records in a structured format, spreadsheet, paper binder by block, or software. Any of those makes the end-of-season pesticide use report far faster to compile. The UC ANR Farm Advisor network publishes sample spray record formats if you need a template. [9]
For operations running multiple vineyard blocks with different spray histories, organizing records by block rather than by date earns back the setup time. It lets you check FRAC rotation block by block instead of reconstructing it from a date-ordered log.
What does a real-world spray program look like using the index across a full season?
Here's a realistic sketch of how a Napa Valley Cabernet grower might use the index through a season. Not a made-up case study, just what the guidance implies under typical conditions.
Bud burst to shoot elongation (late March to mid-April): Temperatures often average below 60°F, so the index sits at 0 or crawls up. Apply a protectant sulfur at or around 3 to 4 inches of shoot growth regardless of the score. This first application targets primary infection, and many growers treat it as a calendar anchor.
Bloom and fruit set (May to early June): The highest-susceptibility window. In warm years, daily averages hit the 70-85°F band for long stretches and push the index to high risk in three to four days. Switch to a DMI or SDHI at 7-day intervals. Track the index daily.
Post-fruit set through veraison (July to August): Berry susceptibility drops after shatter, but rachises and leaves can still host colonies that raise inoculum. Many growers return to sulfur programs at 10 to 14 day intervals if the index falls to moderate. Heat spells above 95°F force resets, but watch the index rebuild fast once the heat passes.
Post-harvest: One sulfur application after harvest, before leaf fall, can cut chasmothecia formation and carry-over inoculum. It's optional and cost-dependent, but in a rough year it's worth a look.
Track the index daily and tie it to your spray log. That keeps you out of calendar habits and gives you documented reasoning behind every application. That combination is exactly what the model was designed to give you.
Frequently asked questions
What is the Gubler-Thomas powdery mildew risk index?
It's a temperature-based forecasting model developed at UC Davis that assigns daily points when average temperatures land in the 70-85°F range. Cumulative scores below 30 mean low risk (21-day spray intervals), 30 to 59 mean moderate risk (14-day intervals), and 60 or above means high risk (7-day intervals). The index resets to zero when temperatures drop below 50°F or exceed 95°F for a day.
How many days in the 70-85°F range does it take to reach high risk?
Three consecutive days with daily average temperatures in the 70-85°F range add 20 points per day, hitting a score of 60 and triggering high risk. If any day in that stretch averages above 95°F or below 50°F, the index resets to zero. Days averaging 50-69°F or 86-94°F hold the index at its current score without adding or subtracting.
Does rain affect the Gubler-Thomas index calculation?
No. The standard Gubler-Thomas model is temperature only. Erysiphe necator, the powdery mildew pathogen, doesn't need free water to germinate or infect, so rainfall isn't built into the index. Rain can actually cut inoculum temporarily by washing spores off surfaces. Some modern adaptations add humidity sensors for other disease models alongside the index, but the core calculation stays temperature driven.
At what growth stage should I start tracking the Gubler-Thomas index?
Start at bud burst, roughly at 1-inch shoot growth. Primary infections from overwintering ascospores can begin that early, and the most critical susceptibility window runs through bloom and fruit set. Waiting until you see green tissue is too late in warm springs. Continue tracking through fruit set at minimum; many growers run the index until post-harvest.
Can I use a regional CIMIS station instead of my own weather station?
Yes, and many growers do. CIMIS data is reliable and the index was originally developed using it. The limitation is microclimate variation: your block may run 3 to 5°F warmer or cooler than the nearest CIMIS station, especially in low-lying frost pockets or on warm south-facing slopes. If your disease pressure consistently mismatches your index predictions, invest in a canopy-height on-site sensor.
What fungicides work best at each risk level?
At low risk, sulfur is effective and cheap. At moderate to high risk, sterol-inhibitor (DMI, FRAC code 3) or succinate dehydrogenase inhibitor (SDHI, FRAC code 7) fungicides are appropriate, with rotation between FRAC codes to manage resistance. During bloom and fruit set at high risk, use your most effective systemic material. Avoid sulfur when temperatures will top 90°F within 24 hours of application because of phytotoxicity risk.
What happens to the index during a heat spike above 95°F?
The index resets to zero. Temperatures above 95°F kill conidia and block germination, which is why the model treats those days as a full reset. But inoculum on bark and in plant tissue doesn't disappear. After the heat ends and temperatures drop back into the 70-85°F range, the index can climb back to high risk within three days. Treat a heat reset as a pause, not a clean break.
Is the Gubler-Thomas index used outside California?
Yes. Washington State University Extension and Cornell University's NEWA network both reference the model for their grape regions. It's considered a solid starting framework in the Pacific Northwest and Northeast, though both programs note that local calibration matters. European disease models often add spore-trapping data alongside temperature, giving inoculum awareness that Gubler-Thomas lacks, but at higher operational cost.
How do I record the index for spray compliance purposes?
Log the index score on the date you make a spray decision and attach it to your pesticide use record for that application. No regulation requires you to document the index, but it builds a defensible rationale for your spray frequency and is invaluable for season-end review. California county agricultural commissioners require pesticide use reports on set monthly windows; the index score supports the timing recorded there.
Does canopy management affect how I should interpret the index?
Yes, a lot. A dense, poorly-managed canopy builds a warmer, more humid microenvironment that favors powdery mildew beyond what ambient temperatures suggest. Growers with aggressive shoot positioning and fruit-zone leaf removal consistently see less disease at the same index score than less-managed blocks. The index runs on ambient temperature and doesn't adjust for canopy architecture, so factor that in when setting spray intervals.
What re-entry intervals apply to powdery mildew fungicides under the EPA Worker Protection Standard?
It depends on the product. Sulfur typically carries a 24-hour REI. Many DMI and SDHI fungicides carry 4-hour REIs. Under EPA WPS at 40 CFR Part 170, workers cannot enter a treated area until the label REI has expired, and growers must post application information on a central notice board or use equivalent notification. Always check the specific product label; REIs vary and the label is the law.
Can highly susceptible varieties like Chardonnay warrant more aggressive spray timing at the same index score?
In practice, yes, though the index itself doesn't adjust for variety. UC Davis research acknowledges varietal susceptibility differences, but the calculation is the same regardless of what you grow. Most experienced growers managing highly susceptible varieties spray at the shorter end of the recommended interval for each risk level and don't wait until the index hits exactly 60 before tightening the program.
Where can I find a pre-calculated Gubler-Thomas index for my region?
UC ANR's IPM website, Cornell's NEWA network, and CIMIS partner portals in California publish pre-calculated outputs for stations in their networks. Confirm the tool runs the actual Gubler-Thomas calculation with the 70-85°F range and the correct reset rules, not a modified version. For blocks with distinct microclimates or where precision matters, running the calculation yourself from your own station data is more reliable.
Sources
- UC Cooperative Extension, Gubler-Thomas Powdery Mildew Risk Index: Gubler-Thomas index thresholds: score 0-29 low risk (21-day interval), 30-59 moderate (14-day), 60+ high (7-day); model developed at UC Davis for E. necator
- UC ANR, Grape Powdery Mildew Disease Management: E. necator overwinters as chasmothecia and mycelium; optimal growth 70-85°F; temps above 95°F kill conidia; primary infection window from bud burst through fruit set
- UC Cooperative Extension, Sulfur Phytotoxicity and Mildew Management in Vineyards: Conidial germination drops sharply below 70°F; sulfur phytotoxicity risk increases when temperatures exceed 90°F within 24 hours of application
- UC Davis Plant Sciences, Weather Station Placement for Vineyard Disease Modeling: On-site canopy-height sensors (3-4 feet) provide more accurate temperature inputs than perimeter-mounted stations for disease index calculations
- California Department of Water Resources, CIMIS Program: CIMIS stations log maximum, minimum, and hourly temperatures at 6-foot height; used as primary data source for original Gubler-Thomas model development
- Washington State University Extension, Grape Pest Management: WSU Extension recommends Gubler-Thomas as the starting framework for powdery mildew spray timing in Washington viticulture
- Cornell University, Network for Environment and Weather Applications (NEWA): NEWA provides pre-calculated Gubler-Thomas outputs alongside the New York Powdery Mildew Risk Assessment model for regional grape growers
- US EPA, Worker Protection Standard for Agricultural Pesticides, 40 CFR Part 170: Under WPS, workers may not enter treated areas until the label re-entry interval has expired; growers must notify workers of applications via central posting
- UC ANR Statewide IPM Program, Grape Pest Management Guidelines: UC IPM powdery mildew guidelines reference Gubler-Thomas model; sample spray record formats available through UC ANR Farm Advisor network
- California Department of Pesticide Regulation, Pesticide Use Reporting: California requires agricultural pesticide use reports filed with county agricultural commissioners on a monthly basis, including application date, product, rate, and acres treated
- UC Davis Plant Pathology, Resistance Monitoring for Grape Powdery Mildew Fungicides: UC Davis monitoring has documented reduced sensitivity to DMI fungicides in California E. necator populations; FRAC code rotation is recommended
Last updated 2026-07-09