UC IPM powdery mildew model: documentation for spray timing justification

TL;DR
- The UC IPM Grape Powdery Mildew Risk Index tracks degree-days above 50°F and 6-hour infection windows between 59°F and 90°F to predict disease pressure.
- Log the model's risk output, your weather station data, and your spray rationale.
- That record is what holds up with organic certifiers, crop insurance adjusters, and CDPR pesticide use reporting.
What is the UC IPM grape powdery mildew model and how does it work?
The UC IPM Grape Powdery Mildew Risk Assessment model is a degree-day and infection-period model built at UC Davis and refined through UC Cooperative Extension. It watches two things at once. First, cumulative heat units, meaning degree-days above a 50°F base temperature counted from budbreak. Second, the occurrence of 6-hour or longer stretches where temperature holds between 59°F and 90°F, which is when Erysiphe necator germinates and infects. [1]
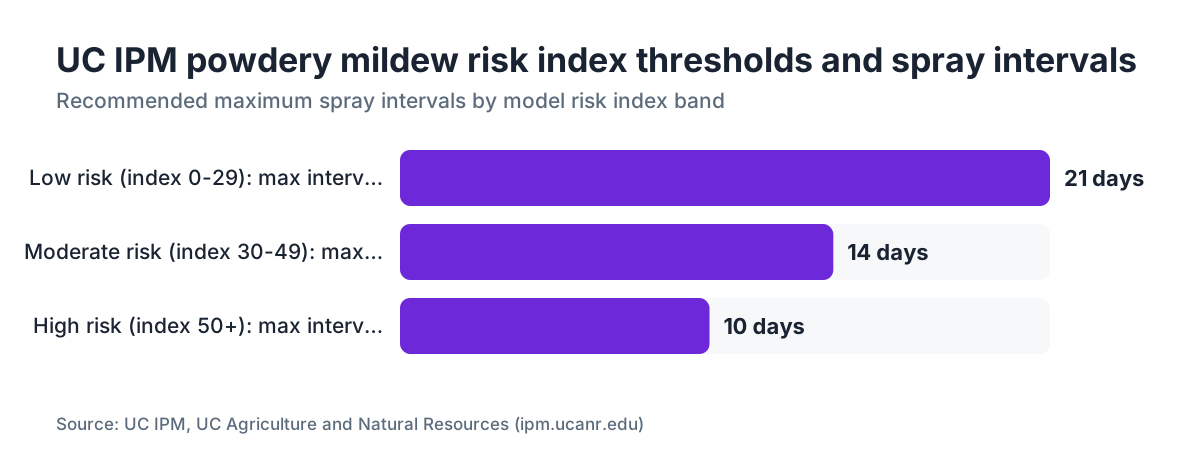
The model outputs a risk index that climbs as those infection periods stack up. At 0 to 29 the vineyard sits at low risk and most programs can stretch intervals. At 30 to 49 the risk is moderate and you want a 10 to 14 day interval with a protectant. At 50 and above you're in the high-risk zone where 7 to 10 day intervals and systemic materials earn their keep. [1]
Degree-day accumulation also tells you where your vines are in growth. By roughly 100 degree-days (base 50°F) after budbreak, shoots are pushing hard and the most susceptible tissue is out in the open. That's when a lot of seasoned growers make the first application, sometimes before the index even crosses 30, because getting powdery mildew wrong in those first four to six weeks is expensive to fix. Nobody has a clean economic threshold study comparing Napa Cab to Zinfandel in high-pressure years, but the foundational model work from UC Davis plant pathologist W. Douglas Gubler has been the California reference point since the early 1990s. [2]
The model is free at the UC IPM website. You can run it with data from a CIMIS station, your own on-site datalogger, or any commercial weather service that reports hourly temperature and relative humidity. [1]
Why does spray timing documentation matter for compliance and audits?
Spray record requirements in California come at you from several directions. The California Department of Pesticide Regulation (CDPR) requires that every restricted-use pesticide application be reported to the county agricultural commissioner within 30 days, with the pest targeted, the site conditions, and the basis for the application. [3] If an inspector asks why you sprayed sulfur on May 12 and again on May 19, "we always spray that often" is not an answer that survives the conversation. A PDF-exported model report showing a 6-hour infection period on May 10 to 11 and a rising risk index is.
Organic certification adds a layer. The National Organic Program (NOP) under USDA AMS requires growers to document pest pressures and their decision-making before applying any allowed material. [4] Your certifier does ask, at annual inspection, whether there was documented pressure behind each sulfur or copper application. Model output, timestamped and tied to a named weather station, answers that cleanly.
Crop insurance is the third pressure point. If you carry USDA Risk Management Agency (RMA) coverage on grapes and you take a powdery mildew loss, your adjuster wants proof you followed an industry-standard IPM protocol. The UC IPM model counts as that standard in California. [9] Missing documentation doesn't automatically kill a claim. It does make one messier.
The EPA Worker Protection Standard (WPS) under 40 CFR Part 170 requires application records be kept for two years and be accessible to workers and their representatives. [5] If your spray timing records live in a notebook nobody can search, you're one inspector visit from a bad afternoon. A structured log tied to model output makes record production fast.
What data do you need to run the UC IPM model and log it properly?
You need four things. A weather source with hourly temperature and relative humidity, the budbreak date for your blocks, access to the UC IPM interface or the underlying degree-day math, and a place to store outputs next to your spray decisions.
Weather sources rank roughly like this. Your own on-site station (Davis Instruments Vantage Pro, Onset HOBO, or similar) is the most defensible because it's literally in your vineyard. CIMIS (California Irrigation Management Information System), run by the California Department of Water Resources, has 145 active stations statewide and gives you hourly data free at et.water.ca.gov. [6] A nearby CIMIS station within 2 to 3 miles in similar terrain is generally fine. Commercial services like Pessl Instruments (iMetos) or Dynamax will format station data into reports, but you still have to document which station you used and how far it sits from your blocks.
For each spray decision, the minimum documentation set is:
- Date and time the model was queried
- Weather station name and station ID
- Current degree-day accumulation (base 50°F, from budbreak)
- Risk index value at the time of decision
- Whether a 6-hour infection period hit in the prior 7 days, and when
- The material applied, rate, and REI [5]
- Name of the person making the decision
That's seven fields. Sounds like a lot. It takes under five minutes once you have a form built. Some growers screenshot the UC IPM output and attach it to the spray record as a PDF, which works fine for paper systems. If you keep digital records, a tool like VitiScribe lets you attach model screenshots directly to spray events so the rationale and the application record stay together.
Recalculate or confirm degree-day accumulation at every spray decision, more than at the start of the season. Warm April spells move fast. A block sitting at 80 degree-days on Monday can be at 130 by Thursday.
How do you calculate degree-days for the powdery mildew model?
The UC IPM model uses the single sine method with a lower threshold of 50°F (10°C) and an upper threshold of 95°F (35°C). The single sine method estimates the daily temperature curve from the daily max and min, then measures the area above the base. [1]
Here's the quick manual version. If your daily max is 78°F and your daily min is 52°F, the average is 65°F. Subtract the 50°F base and you get 15 degree-days for that day. Over a 10-day stretch with similar temperatures you'd stack roughly 150 degree-days. That puts you well inside the window where susceptible tissue is exposed and infection periods matter.
The upper threshold matters. Very hot days above 95°F don't contribute as many degree-days as you'd expect, because heat above 95°F actually suppresses the pathogen. That's one reason degree-days alone don't tell the whole story in the Central Valley during a heat wave.
Most growers skip the arithmetic. The UC IPM website has a degree-day calculator that takes CIMIS station data directly, and CIMIS itself calculates temperature accumulations for you. [6] If you'd rather run a spreadsheet, the single sine formula is documented in UC ANR Publication 3343, the Grape Pest Management manual. [2]
Start accumulation at budbreak for each block, not January 1. Different blocks can sit at meaningfully different totals by mid-May if they differ in aspect, elevation, or training system.
What does a 6-hour infection period mean and how do you document it?
An infection period in the UC IPM model is any continuous stretch of at least 6 hours where temperature holds between 59°F and 90°F. Erysiphe necator conidia germinate and penetrate host tissue inside that window, and the longer the period, the heavier the inoculum load. [1] The 6-hour threshold comes from controlled inoculation studies. The pathogen needs about 6 hours of favorable temperature to finish germination and form the appressorium that punches into a susceptible surface.
You don't need relative humidity to flag an infection period in the model's basic version, because E. necator is a dry-weather pathogen. It doesn't need free water. It needs temperature in range and viable spore-producing colonies nearby. That's what separates powdery mildew from downy mildew or botrytis, where wetness duration drives everything.
To document infection periods, pull your hourly temperature log from your station or CIMIS for the 7 to 14 days before each spray decision. Flag every stretch of 6 or more consecutive hours between 59°F and 90°F. Note the start date, end date, and total duration. That becomes part of your spray justification.
Say you had three infection periods in the 10 days before a spray and your index sat at 45. You have a clear written case. Now say you sprayed at an index of 12 with no infection periods in the prior week. You need a different justification (maybe you're protecting against late-season pressure from a neighboring block, or you're on a fixed-calendar program your buyer requires). Write that reasoning down too.
How should spray records be structured to satisfy CDPR and NOP requirements?
Think in two layers. CDPR's pesticide use reporting (PUR) system requires specific fields no matter what drove your decision, and the model documentation sits beside that record, not inside it. [3]
Layer 1 is the regulatory record: the completed DPR-ENF-121 form (or your licensed PCA's written recommendation), the county PUR submission, and the WPS application record with REI posted. These have fixed formats set by CDPR and EPA. [3][5]
Layer 2 is your IPM decision record, which is what certifiers and adjusters actually read. It links to Layer 1 by date and block ID, and it holds:
- The model risk index and degree-day accumulation at the time of decision
- The weather station ID and distance from the block
- A note on recent infection periods (dates, durations)
- The material selected and why (sulfur chosen because index was 35 inside a 14-day interval; would move to FRAC 3 above 50)
- Any scouting notes (visible colonies, growth stage, canopy density)
The NOP at 7 CFR Part 205 states that organic producers must maintain records that demonstrate compliance for 5 years. [4] That 5-year clock runs longer than CDPR's 3-year requirement and WPS's 2-year requirement, so if you're certified organic, use 5 years as your baseline and cover all three with one policy.
Format matters less than consistency. A spreadsheet with one row per application works. A paper log in a binder works. What doesn't work is records scattered across three notebooks, your PCA's files, and a text thread with your spray crew lead.
What are the UC IPM model's risk thresholds and what spray intervals do they suggest?
The UC IPM model sorts risk into three bands. The table below shows the thresholds and the intervals generally tied to each, drawn from UC IPM's online guidelines. [1]
| Risk Index | Pressure Level | Suggested Interval | Notes |
|---|---|---|---|
| 0 to 29 | Low | 14-21 days | Protectant sulfur is adequate if timing is right |
| 30 to 49 | Moderate | 10-14 days | Consider FRAC 3 or FRAC 11 if overdue |
| 50+ | High | 7-10 days | Systemic materials; rotate FRAC groups |
These intervals assume full coverage and correct rates. Running a high-vigor canopy with dense shoots? Shorten the interval by 2 to 3 days regardless of the index, because protectant penetration and redistribution fall off fast in thick canopies.
The risk index doesn't reset after a spray. It keeps accumulating. That's a detail worth logging: record the index before the spray (the trigger) and then track its trajectory afterward to show when the next decision point arrives. Some growers log the index weekly even when they don't spray, which builds a continuous record of the season's pressure curve.
Regional versions differ. WSU's Powdery Mildew Forecaster for Washington uses a related architecture, and Cornell's grape disease resources in the Northeast apply the Gubler-Thomas model as well. [7][8] If you farm across states or advise growers in several regions, know that thresholds and calculation methods vary. The UC version is calibrated for California.
How do you justify a spray decision when the model says risk is low?
This happens more than people admit. You're on a calendar program, your buyer requires a set interval, or you're getting ahead of a forecast infection period that hasn't landed yet. All legitimate. The documentation just looks different.
For calendar or buyer-required programs, name the requirement in the record. Something like: "Spray applied per buyer specification requiring 14-day maximum interval on Chardonnay blocks regardless of model risk; risk index was 22 at application." That's honest. An organic certifier won't ding you for spraying approved sulfur more often than strictly needed. They want to see an allowed material and a stated reason.
For pre-emptive protection ahead of a forecast infection period, pull the 7-day forecast and note it: temperatures projected to hold in the 65 to 85°F range for the next 5 days, likely infection periods before the next scheduled spray. Record the forecast source (NOAA, your ag weather service) and the date you pulled it. Forecast-based justification is weaker than model output, but it beats silence.
For late-season applications near harvest, document the variety's susceptibility directly. Late-season Zinfandel clusters are notorious for berry infection even at low index values, because sporulating colonies from earlier in the season are still around and berry skin grows more susceptible as sugars climb. Put that observation in the record.
How do PCAs fit into the model documentation workflow?
In California, any restricted-use pesticide application requires a written recommendation from a licensed Pest Control Adviser (PCA) before you spray. [3] That recommendation is a legal document, and it should reference the basis for the call, which is exactly where the UC IPM model belongs.
A good PCA recommendation for a powdery mildew spray carries the current model risk index, any recent infection periods, the target pest, and the chosen material with its FRAC group. Plenty of PCAs attach a printed model output or name the CIMIS station used. If your PCA's recommendations skip this detail, ask for it. It protects the PCA as much as it protects you.
If you self-certify as a PCA or operate under a qualified supervisor on a restricted materials permit, the same standard applies to your own written records. You're writing your own recommendation, and it has to survive the same scrutiny.
CDPR's PCA licensing and continuing education requirements include IPM documentation standards. [3] PCAs in California have to complete continuing education units, and UC Cooperative Extension runs sessions on powdery mildew modeling and spray record documentation that count toward them. [10]
What are the best tools and resources for accessing the UC IPM powdery mildew model?
The primary access point is ipm.ucanr.edu, maintained by UC ANR (Agriculture and Natural Resources). The grape powdery mildew pages hold the model description, degree-day calculator links, and management guidelines. [1] The site is free, and the degree-day tools pull straight from CIMIS and other California weather networks.
CIMIS (et.water.ca.gov) is your weather backbone in California. [6] Set up a free account, find the stations closest to your blocks, and download hourly temperature and relative humidity as CSV. That CSV is your documentation source for degree-day calculations and infection period identification.
UC Cooperative Extension farm advisors in each county will help you set up a site-specific version of the model. [10] Advisors keep office hours, and many make site visits during the growing season. This is probably the most underused free resource in California viticulture.
Want a more structured digital workflow? Spray record platforms that ingest weather station data and model outputs cut the documentation burden a lot. Whatever system you pick, it has to produce records you can export, print, or hand to a certifier or adjuster in under five minutes. If it takes longer, the system isn't working for you.
WSU Extension's grape powdery mildew resources at pubs.extension.wsu.edu are worth a bookmark even for California growers, because they hold some of the best practical spray timing guides anywhere. [7] Cornell's grape disease resources at grapes.cornell.edu cover the Gubler-Thomas model in Northeast conditions. [8]
How do you build a season-long powdery mildew documentation file that holds up?
Start before budbreak. Record the approximate budbreak date for each block (or each variety, if you farm several in one block). That's your degree-day start point, and it needs to be in writing.
Set a weekly rhythm from budbreak through veraison. Every Monday morning, pull the prior week's model output, log the current risk index and degree-day accumulation, note any infection periods, and record any sprays from the past week. Fifteen to twenty minutes per farm. It builds a continuous, timestamped record that shows a pattern of monitoring instead of decisions made in isolation.
After veraison, foliar pressure eases but berry infection risk stays. Keep logging weekly through harvest. Some organic certifiers look hard at late-season decisions on wine grapes, because late copper or sulfur has residue implications for fermentation.
At season's end, compile the weekly logs, spray records, model outputs, and CIMIS data pulls into one season file per block. Label it with the vintage year, block ID, and variety. Store it digitally with a backup. Your 5-year NOP retention clock starts the day harvest wraps.
If you run VitiScribe or a similar platform, export the season file at harvest and archive it offline too. Cloud platforms get acquired, change pricing, or shut down. Your compliance records should never live in only one place.
Here's the practical reality. Growers who build this habit in year one spend about 30 minutes a week during spray season. Growers who reconstruct it at audit time spend days piecing a story together from fragments. Set the habit in April and you won't think about it again until someone asks.
Frequently asked questions
Does the UC IPM powdery mildew model work for all grape varieties, or only some?
The model applies to all Vitis vinifera varieties, but susceptibility differs a lot. Chardonnay, Cabernet Sauvignon, and Zinfandel are highly susceptible; some hybrids carry partial resistance. The risk index doesn't adjust for variety, so growers of highly susceptible varieties should treat an index of 35 to 40 the way less-susceptible growers treat 50. Write your variety-specific rationale into your spray records.
Can I use a personal weather station instead of CIMIS for the model inputs?
Yes, and for most blocks it's better. A calibrated on-site station gives you data from your microclimate rather than conditions 3 to 5 miles off. Document the brand, model, calibration date, and GPS coordinates. If you use an on-site station, note that sensor height, placement (out of direct sun, away from pavement), and maintenance meet standard agricultural weather station guidelines.
How long do I need to keep powdery mildew spray records in California?
CDPR pesticide use records: 3 years. EPA WPS records: 2 years. USDA NOP organic certification records: 5 years. If you're a certified organic grower in California, use 5 years as your standard retention period and satisfy all three with one policy. Digital storage with a backup outside your primary platform is the safest approach.
What is a FRAC group and why does it matter for my spray records?
FRAC is the Fungicide Resistance Action Committee, and FRAC groups classify fungicides by mode of action. Rotating groups keeps resistant Erysiphe necator populations from building. For documentation, noting the FRAC group (Group 3 for triazoles, Group 11 for strobilurins, Group M for sulfur) shows you're following resistance management guidelines, which certifiers and crop insurance reviewers look for.
Do I need a PCA recommendation for every sulfur application on grapes in California?
If the product label makes sulfur a restricted-use pesticide and you're in California, yes. Many agricultural sulfur formulations are not restricted-use, so a PCA recommendation isn't legally required. Check the specific product's California registration status. Even when it's not required, keeping a written rationale for every application is good practice for organic certification and crop insurance.
What does the UC IPM model say about powdery mildew risk after a heat wave?
Sustained temperatures above 95°F temporarily suppress Erysiphe necator, and the model's 95°F upper threshold accounts for it. But colonies survive heat events and resume sporulating fast once temperatures fall back into the 65 to 85°F range. After a heat wave, reassess the index the moment temperatures moderate and assume protected colonies are ready to go. Don't extend intervals on the strength of a heat event alone.
How do I document the UC IPM model for crop insurance if I have a powdery mildew loss?
Pull the full season's model log, weekly risk index records, CIMIS downloads, and all spray records with rationale. The USDA RMA adjuster wants proof you followed a recognized IPM protocol, and the UC IPM model qualifies. Hand over the complete file, not cherry-picked records. If you deviated from model recommendations at any point, say why. Adjusters spot incomplete records.
Is the Gubler-Thomas model the same as the UC IPM powdery mildew model?
Yes. The model commonly called the UC IPM Grape Powdery Mildew Risk Assessment rests on the work of W. Douglas Gubler and colleagues at UC Davis, known in academic literature as the Gubler-Thomas model. Cornell and WSU extension programs have adapted versions for their climates. The base thresholds and degree-day temperatures stay consistent, but regional adaptations exist for the Northeast and Pacific Northwest.
Can I use the UC IPM model documentation for a CCOF or other certifier audit?
Yes. CCOF and most other USDA-accredited certifiers accept UC IPM model outputs as documentation of pest monitoring and decision-making under the National Organic Program. The point is that your records show you monitored pressure, assessed risk, and decided based on that assessment. A printout or export tied to your spray record by date and block ID meets the requirement.
How does the UC IPM model compare to models used in Washington and New York?
WSU uses a similar degree-day and infection-period framework calibrated for the Pacific Northwest, published through WSU Extension. Cornell's resources at grapes.cornell.edu apply the Gubler-Thomas model adapted for Northeast humidity and temperature. The core biology matches, but specific risk thresholds and recommended intervals differ. If you farm across states, use each state's model and guidelines and document which one you applied where.
What's the minimum documentation I need if I'm not certified organic and don't carry crop insurance?
California CDPR requires pesticide use reports for restricted-use materials within 30 days of application, with pest target and site conditions noted. For non-restricted materials, no state filing is required, but county agricultural commissioners can and do audit spray records. At minimum, keep a dated log of every application with product, rate, block, and a one-sentence reason. Two minutes per application, and it protects you if a neighbor complaint or worker incident triggers a review.
How do I handle model documentation if my weather station data has gaps?
Note the gap in your record: the dates affected and the reason (power outage, sensor failure). Fill it using the nearest CIMIS station and record that station ID and distance. Don't interpolate or guess. Auditors and adjusters worry less about gaps than about undisclosed gaps. A transparent note that reads 'station offline May 3-5; degree-days estimated from CIMIS Station 80, 4 miles northeast' is defensible. Silence about a gap is not.
Sources
- UC IPM, University of California Agriculture and Natural Resources, Grape Powdery Mildew Management Guidelines: The UC IPM model tracks degree-days above 50°F base temperature and 6-hour infection periods between 59°F and 90°F to generate a risk index for grape powdery mildew; risk thresholds are 0-29 (low), 30-49 (moderate), and 50+ (high).
- UC ANR Publication 3343, Grape Pest Management, 3rd edition: The single sine degree-day calculation method and the foundational Gubler-Thomas powdery mildew model are documented in UC ANR's Grape Pest Management manual.
- California Department of Pesticide Regulation, Pesticide Use Reporting and PCA Requirements: California CDPR requires pesticide use reports for restricted-use pesticides within 30 days and requires a written PCA recommendation before application of restricted-use materials.
- USDA Agricultural Marketing Service, National Organic Program, 7 CFR Part 205: The NOP at 7 CFR Part 205 requires certified organic producers to maintain records demonstrating compliance for 5 years, including pest monitoring and spray decision rationale.
- EPA, Worker Protection Standard, 40 CFR Part 170: EPA WPS regulations at 40 CFR Part 170 require that pesticide application records be kept for 2 years and be accessible to workers and their designated representatives.
- California Department of Water Resources, California Irrigation Management Information System (CIMIS): CIMIS operates 145 active weather stations across California providing free hourly temperature and relative humidity data for agricultural use, including degree-day calculations.
- Washington State University Extension, Grape Powdery Mildew Management: WSU Extension uses a degree-day and infection-period model framework for grape powdery mildew management adapted to Pacific Northwest conditions.
- USDA Risk Management Agency, Whole Farm Revenue Protection and Specialty Crop Insurance: USDA RMA adjusters review IPM compliance records when evaluating specialty crop loss claims, and following an industry-recognized protocol such as the UC IPM model supports claim documentation.
- UC Cooperative Extension, Integrated Pest Management in California Vineyards: UC Cooperative Extension farm advisors provide county-level support for implementing the UC IPM grape powdery mildew model and spray record documentation in California vineyards.
Last updated 2026-07-10