Documenting spray coverage assessment using water sensitive paper cards

TL;DR
- Water-sensitive paper cards turn yellow when wet and develop blue-to-dark-blue spots where spray droplets land.
- Place them at multiple canopy positions during a spray run, photograph them, measure coverage percentage and droplet density, and log the results in your spray records.
- UC Davis and Cornell extension both recommend targeting 20-30 droplets per square centimeter for fungicide coverage on grapevine foliage.
What are water-sensitive paper cards and how do they work?
Water-sensitive paper (WSP) cards are small yellow cards coated with a bromocresol green dye that reacts with water. When a droplet hits the card, the dye oxidizes and turns a distinct blue-to-dark-blue color. The rest of the card stays yellow. That color contrast is what makes them useful: you can see exactly where spray landed and where it didn't.
The cards don't measure pesticide chemistry or biological efficacy. They measure physical coverage, meaning how much of a target surface the spray pattern actually reaches. That distinction matters a lot. A product might be applied at the correct rate and still miss 40 percent of the leaf surface if your nozzle angle is off or your speed is too high. The card exposes that gap. [1]
Commercially, the most common cards are 26mm x 76mm (roughly business-card-sized) and come on perforated sheets or in dispensing boxes. Syngenta's Teejet-brand WSP cards are the standard most extension programs reference, though other manufacturers produce equivalent products. Cards must stay dry before use, so keep them sealed in their foil pouch until the moment you clip them to the vine.
Why should vineyard managers bother documenting spray coverage assessments?
Spray coverage documentation does two things that matter operationally. First, it tells you whether your equipment is actually delivering product to the target zone, which affects disease pressure and pesticide resistance risk. Second, it creates a defensible record if a regulatory agency, certifier, or neighbor questions your application practices.
The EPA Worker Protection Standard (WPS) at 40 CFR Part 170 doesn't explicitly require WSP card documentation, but it does require that pesticides be applied in a manner consistent with the product label, and labels for most vineyard fungicides specify adequate coverage of foliage. [2] If you're operating under a third-party audit like CCOF, Lodi Rules, or SCS Global, those programs increasingly ask for calibration and coverage records that go beyond the basic spray log. WSP card results are among the cleanest ways to satisfy that ask. If you want the underlying application data organized before you ever get to coverage checks, start with a solid spray record habit.
From a purely agronomic angle, a UC Davis Cooperative Extension study on botrytis management found that inconsistent canopy penetration was one of the primary contributors to failed fungicide programs in California coastal vineyards. Nobody has perfectly clean data on the exact coverage-to-efficacy relationship across all pathosystems, but the directional finding is consistent: poor coverage correlates with poor control. [3]
For small winery owners doing their own spraying, this kind of documentation also demonstrates due diligence. If a crop damage complaint ever comes up from a neighboring property, your dated, photographed card records are far better evidence than a handwritten log entry saying 'sprayed block 4.'
How do you place water-sensitive paper cards in a vineyard for a valid spray test?
Placement is where most growers cut corners, and it's the step that determines whether your data means anything.
The basic rule is to represent the full target zone. For grapevines, that means placing cards at three positions per sampling point: the top of the canopy (shoot tips and upper cluster zone), the middle of the fruiting wire zone (where clusters actually hang), and the lower canopy near the cordon. If you're spraying both sides of the row, you need cards on both the drive-row side and the interior canopy.
Cornell's viticulture extension program recommends a minimum of two sampling locations per block for routine calibration checks, and at least five locations if you're doing a formal equipment audit or trying to diagnose a coverage problem. [4] For a 10-acre block, I'd personally go with three to four locations spread across the block width, more than one end.
Use clothespins, twist ties, or small binder clips to attach cards to the vine's shoot or wire. The card face (the yellow side) should face the direction spray is coming from. Don't fold or bend the card. Don't touch the yellow face with bare hands because skin oils interfere with the dye reaction.
Mark each card before the run. Use a pencil (not pen, ink bleeds when wet) to write the location code and position (top, mid, bottom, near side, far side) on the back. You can also pre-number them on a field map so you know exactly which card goes where. That field map becomes part of your documentation package.
Collect cards within a few minutes of the spray run. Humidity will eventually cause cards left out too long to fog with ambient moisture, and that ruins the reading. Once collected, slide them into individual paper envelopes or a dry folder immediately.
What coverage percentage and droplet density targets should you aim for?
The two metrics you read from WSP cards are percent coverage and droplet density.
Percent coverage is the fraction of the card surface that turned blue. Droplet density is the number of individual droplet impacts per unit area, usually expressed as droplets per square centimeter (drops/cm²).
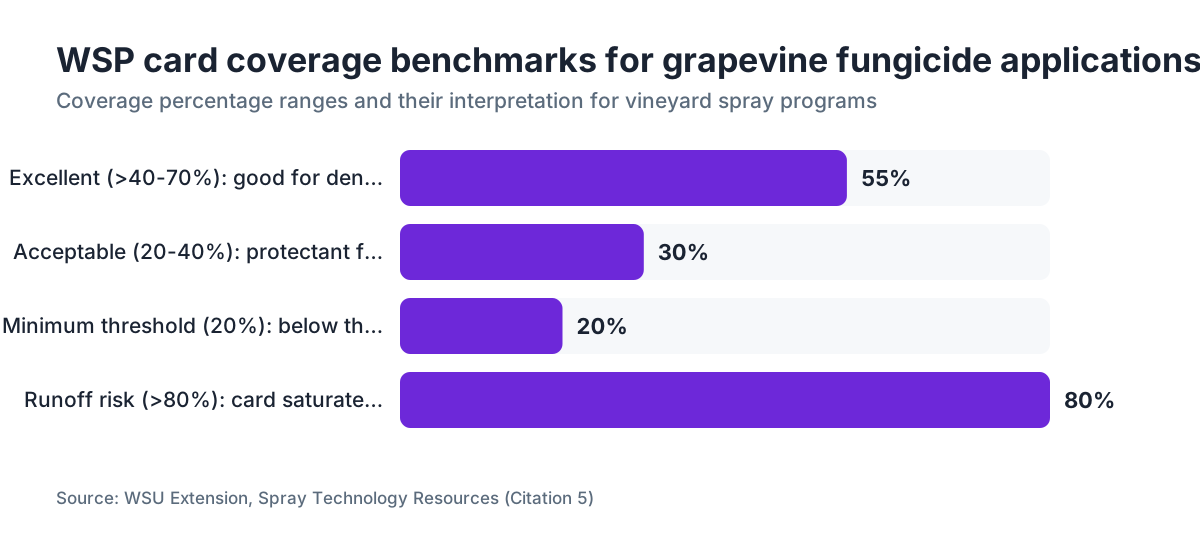
For grapevine fungicide applications, WSU Extension puts the general target at 25 to 75 percent coverage and 20 to 30 drops/cm² as the minimum droplet density for adequate fungal disease suppression. [5] The lower end of that range applies to protectant fungicides applied to relatively open canopies early in the season. The upper end applies to dense canopies mid-season or to curative chemistries where more coverage means more active ingredient reaching the infection site.
Droplet size also matters. A card showing 20 percent coverage from large droplets (greater than 400 microns VMD) tells a different story than 20 percent coverage from fine droplets (100-200 microns VMD). Large droplets deliver more volume per impact but fewer contact points. Fine droplets give more contact points but may drift off target. The card shows you the impact pattern; the nozzle spec sheet or a water-sensitive card scanner tells you droplet size distribution. [6]
Here's the practical benchmark table extension programs use:
| Coverage % | Droplet density (drops/cm²) | Interpretation |
|---|---|---|
| Less than 20% | Less than 15 | Inadequate, likely under-dose to target |
| 20-40% | 15-30 | Acceptable for protectant fungicides, open canopy |
| 40-70% | 30-50 | Good, appropriate for most fungicide programs |
| Greater than 70% | Greater than 50 | Excellent, may indicate over-application risk |
| Greater than 80% | Card saturated | Unreadable, likely runoff occurring |
Card saturation (the whole card turns dark blue with no distinct spots) means runoff, which is waste and a potential water quality issue. That result is just as actionable as under-coverage.
How do you read and measure the results on a WSP card?
There are three methods, ranging from free and approximate to paid and precise.
The simplest method is visual estimation with a reference chart. Syngenta and other WSP card manufacturers supply printed overlay templates that show 10%, 25%, 50%, and 75% coverage patterns. You hold your card next to the reference card and pick the closest match. This takes about 10 seconds per card and is accurate to within roughly plus or minus 10 percentage points. For routine calibration checks, that accuracy is fine. [1]
The second method is free image analysis software. DepositScan, developed by USDA-ARS and freely available, analyzes a scanned or photographed WSP card image and returns percent coverage and droplet density counts. You scan your cards at 600 DPI on a flatbed scanner, upload the images to the software, and get a quantified result. Cornell extension has published a protocol for using DepositScan specifically with grapevine applications. [4] The software is real, it works, and it doesn't cost anything. The limitation is that card photography needs consistent lighting, and any background color contamination from staining will throw off the analysis.
The third method is a dedicated card scanner or phone app. Several commercially available systems, including phone-based readers that use proprietary algorithms to score cards from camera images, exist at various price points. These cost anywhere from free (basic app tier) to several hundred dollars for a calibrated hardware scanner. I wouldn't spend money on the hardware version for most small operations. DepositScan does the job.
Whatever method you use, the reading should happen the same day cards are collected. Over time, humid air causes further dye migration that slightly expands the apparent spot size, making coverage look higher than it was.
What records do you need to keep after a WSP card assessment?
Your documentation package for each spray coverage assessment should include at minimum: the date, the block or parcel identifier, the application equipment used (sprayer type, nozzle type, nozzle spacing, pressure, tractor speed, gallons per acre applied), the card placement map showing which position each card occupied, the cards themselves or scanned/photographed images of them, and the coverage measurement result for each card. [2]
Keep the cards themselves if you can. A lot of regulatory and certification auditors want to see physical cards or archived images, more than a summary number. Glue or tape them onto a plain sheet of paper with the position label written next to each card, then scan the whole sheet. That single scan becomes both the physical record and the digital backup. Date the scan file name.
For records tied to pesticide applications, California requires pesticide use reports (PURs) to be submitted to the county agricultural commissioner within specific timeframes, and other states have parallel requirements. [7] WSP card records aren't formally part of the PUR in most states, but they support the label-compliance claim embedded in every application record. Store them with your spray logs.
This is where a digital field operations platform helps. A tool like VitiScribe lets you attach card images directly to a spray record, so the coverage data and the application log are linked in one place rather than sitting in two separate folders that might drift apart over years. That kind of linkage becomes genuinely useful when an auditor asks you to pull three years of records for a specific block. If you're still building that filing muscle, our guide to compliance recordkeeping walks through the retention rules by program.
Retention requirements vary by state and certification program. The WPS requires pesticide records to be kept for two years. [2] Most organic certifiers require three years minimum. Build your filing habit around the longest retention period you're subject to.
How do WSP card results help you calibrate and improve your sprayer?
WSP cards are diagnostic tools, more than compliance checkboxes. When you read the pattern on a card, it tells you specific things about what went wrong.
If you have good coverage on the near-row side of the card but poor coverage on the interior canopy card, you have a canopy penetration problem. Possible causes include excessive leaf density (a canopy management issue, not a sprayer issue), too much tractor speed, too little air volume from the sprayer fan, or nozzle angle not matched to the canopy profile.
If you have satellite droplets or irregular spotting on the card, you may have excessive pressure causing droplet fragmentation or a worn nozzle producing an irregular spray pattern. WSU Extension's spray technology resources include detailed diagnostic guides for interpreting these visual patterns. [5]
If coverage is uniformly low across all positions, you're either traveling too fast, running too low a volume rate, or your nozzle output has degraded. Nozzles should be checked for output volume and pattern uniformity at least every 25 acres of use, and WSP cards are a fast way to see pattern issues that a simple bucket-catch nozzle check won't reveal.
A practical calibration session takes about 45 minutes. Set up cards at five or six positions through a test row. Run your sprayer at normal operating speed, pressure, and fan setting. Collect cards. Read them before making any adjustments. Then change one variable at a time, such as reducing speed by 15 percent, and run another set of cards in an adjacent row. Compare results. This one-variable-at-a-time approach, rather than adjusting two or three things at once, is how you actually learn what your equipment is doing. Pair the card results with your written sprayer calibration log so the adjustments are traceable. [6]
Are there any limitations or common mistakes with water-sensitive paper cards?
WSP cards have real limitations that extension materials don't always emphasize enough.
First, they only tell you about the moment and location of the test. Coverage can be excellent at the sampling locations and poor 50 feet down the row if nozzle wear is uneven across the boom or if the canopy profile changes. Sample enough locations to catch that variability.
Second, cards are sensitive to ambient humidity. At relative humidity above 65-70 percent, cards can develop faint background staining from ambient moisture even before the spray hits them. Always check your baseline: expose one card to ambient air but not to spray, and if it shows significant background color, your conditions are marginal for card use. Morning spraying in coastal vineyards is particularly problematic. [3]
Third, cards don't distinguish between your spray and drift from an adjacent application or from irrigation fog. If there's another sprayer working in a neighboring block, your card results are compromised.
Fourth, the cards can't tell you about spray coverage on the underside of leaves, which is where powdery mildew and certain other pathogens actually infect. Cards placed leaf-underside-up can help, but they're harder to clip securely and easier to miss. Some practitioners use a separate set of cards attached face-down to wooden skewers positioned inside the canopy. It takes more setup but gives you the full picture.
Finally, WSP cards measure water deposition, not product deposition. If your sprayer uses oil-based adjuvants at high concentration, the card's hydrophilic dye may not react normally. In those situations, card results should be cross-referenced with other coverage indicators like tracer dyes.
How do tracer dyes compare to water-sensitive paper cards for coverage assessment?
Tracer dyes, typically fluorescent materials like Brilliant Sulfo Flavine (BSF) or Tinopal, are added to the spray tank and their deposition is later measured either visually under UV light or via spectrophotometric analysis of leaf washings. They give you an integrative coverage picture over the whole canopy rather than a snapshot at card locations.
The tradeoff is time and cost. Reading tracer dye results requires either a UV lamp walkthrough (which is qualitative) or lab analysis of leaf samples (which costs money and takes days). WSP cards give you results in minutes. For routine calibration checks, cards win on practicality. For a detailed equipment audit or a research-grade coverage study, tracer dyes give you better spatial resolution.
Some programs use both. Cards tell you immediately after the spray run whether gross coverage targets were met. Tracer dye sampling tells you later whether distribution within the canopy was uniform. Cornell and UC Davis both describe this complementary approach in their integrated pest management resources. [4] [3]
For most vineyard managers doing their own sprayer calibration once or twice a season, WSP cards are the right tool. If you're contracting custom spray work and want to verify contractor performance, tracer dyes or a third-party coverage audit might be worth the extra investment.
What does a complete spray coverage documentation package look like for an audit?
If a certifier or inspector asks for your spray coverage records, here's what a complete package looks like.
A single assessment event should produce: a dated field map with card placement locations marked, a photo or scan of each card labeled with its position code, a data sheet recording the coverage percentage and droplet density for each card (with the measurement method noted), the sprayer configuration at time of testing (nozzle model, pressure in PSI, tractor speed in MPH, gallons per acre, fan RPM or setting if applicable), and any corrective actions you took based on the results.
If you're using a digital system, the card images should be attached to the corresponding spray event record, not sitting in a separate photo folder. Auditors lose patience fast when records are fragmented across multiple systems or folders. The cleaner your linking between the application log and the supporting evidence, the faster the audit goes.
For growers on the vineyard path toward organic or sustainable certification, this documentation is typically reviewed at the annual inspection visit. Programs like Lodi Rules ask specifically about how spray equipment calibration and coverage are verified. Having dated WSP card records going back three or more seasons shows a consistent practice, not a one-time scramble before the audit.
Store digital records in at least two locations. Local hard drive plus cloud backup, or your field software's cloud storage plus a quarterly export to your own system. Paper cards in a labeled binder per season work too, and some auditors actually prefer seeing the physical cards.
Where can you get water-sensitive paper cards and what do they cost?
WSP cards are available from most agricultural spray supply distributors, and from a few direct sources.
Syngenta's TeeJet Technologies division sells them directly and through retailers under the TeeJet brand. A pack of 100 cards typically costs $15 to $25, though pricing varies by region and supplier. For a season's worth of calibration checks (say, four to six spray assessments per block across two or three blocks), a single 100-card pack is usually enough for one season. [6]
Other suppliers include Greenleaf Technologies and Spraying Systems Co., both of which produce equivalent cards at similar price points. Agricultural retailers like Wilbur-Ellis, Helena Agri-Enterprises, and many local co-ops carry them seasonally.
University extension plant protection programs at UC Davis, Cornell, and WSU sometimes distribute small quantities of WSP cards at pest management workshops or through county farm advisors. If you're attending a spray training session, check whether cards are included in the workshop materials.
One practical note: don't stockpile more than a one or two season supply. The cards have a finite shelf life because the dye degrades over time, especially if the foil pouch has been opened. Cards more than two to three years old may show inconsistent reactions. Store unopened pouches in a cool, dry location away from any spray chemical storage.
Frequently asked questions
How many water-sensitive paper cards should I use per block?
Cornell extension recommends a minimum of two card locations per block for routine calibration, with five or more for a formal coverage audit. At each location, place cards at three canopy heights: top, mid-cluster zone, and lower cordon area. For a block with significant canopy variability or irregular terrain, add locations to capture that variability. More cards give you more confidence that your results represent the full block.
Can I reuse water-sensitive paper cards?
No. Once a card has been exposed to spray (or significant ambient moisture), the dye has reacted and the card can't be reset. Each card is single-use. The good news is they're inexpensive, roughly 15 to 25 cents each depending on pack size, so budget for fresh cards at every assessment session.
What is the ideal droplet density for grapevine fungicide applications?
WSU Extension cites 20 to 30 droplets per square centimeter as the minimum target for fungicide coverage on grapevine foliage, with higher density preferred for dense canopies or curative applications. Droplet density below 15 drops/cm² is generally considered inadequate for disease suppression. You can measure droplet density using free software like USDA-ARS DepositScan from scanned card images.
Do water-sensitive paper cards work in humid conditions?
They work poorly when relative humidity exceeds 65 to 70 percent. At high humidity, ambient moisture can trigger the dye and create background staining that makes card images hard to read. Always test one unexposed card as a blank before your spray run. If the blank shows noticeable color change from ambient air alone, card results from that session won't be reliable.
How do I photograph water-sensitive paper cards for my records?
Photograph cards on a flat white or light gray background in consistent natural light, avoiding direct shadows across the card face. Use the highest resolution setting on your phone camera. For DepositScan analysis, scan cards on a flatbed scanner at 600 DPI with the card face down. Label each card in the image or immediately in the file name with the date, block, and position code before filing.
Does the EPA Worker Protection Standard require spray coverage documentation?
The WPS at 40 CFR Part 170 requires pesticide records to be kept for two years and requires applications to be consistent with product labeling, which typically requires adequate target coverage. The WPS doesn't specifically mandate WSP card records, but those records support label compliance claims and satisfy the documentation requirements of most third-party sustainability and organic certification audits.
How do I interpret a water-sensitive paper card that's completely dark blue?
A fully saturated card, one where no individual droplets are distinguishable and the whole surface is dark blue, indicates runoff. The spray volume or droplet density exceeded what the surface could hold before liquid ran off. This means product was wasted, the record is unreadable for coverage analysis, and there may be a surface water contamination concern. Reduce application rate, increase speed, or adjust nozzle size to correct.
What software can I use to analyze water-sensitive paper card images?
USDA-ARS developed DepositScan, a free program that analyzes scanned WSP card images and returns percent coverage and droplet count data. Several commercial smartphone apps also analyze WSP card photos with varying accuracy. For most vineyard operations, DepositScan offers the best combination of accuracy and cost (free). Cornell extension has published a protocol for using DepositScan specifically with vineyard canopy spray assessment.
How often should I do a spray coverage assessment in my vineyard?
At minimum, do a coverage assessment at the start of each spray season after any equipment change or nozzle replacement, and after any significant canopy change like hedging or leaf pulling. In practice, one assessment per major growth stage, such as pre-bloom, fruit set, and bunch closure, catches the canopy changes that most affect coverage. That's roughly three assessments per season for a typical program.
Can WSP cards detect coverage on the underside of grapevine leaves?
Standard card placement captures the spray pattern at the card's face, which is typically positioned facing the spray direction. To assess undersurface coverage, you need to position cards face-up inside the canopy, attached to stakes or wires so the face points upward (simulating the leaf underside orientation). This is more setup-intensive but matters for pathogens like downy mildew that infect primarily through stomata on the underside of leaves.
How do spray coverage records help with pesticide resistance management?
Resistance develops faster when pathogen populations experience sublethal pesticide exposure, which poor coverage causes directly. If your WSP card records show consistently low coverage at inner-canopy positions over multiple seasons, and you're also seeing fungicide failures, the coverage gap is a plausible contributing factor. Documented coverage history helps you separate equipment and application problems from chemistry resistance when diagnosing spray program failures.
What information should I write on the back of each water-sensitive paper card before the spray run?
At minimum: date, block or parcel ID, card location code matching your field map, and canopy position (top, mid, bottom) plus side (near row, far row). Use a soft pencil, not pen, because ink bleeds when the card gets wet. Writing this before the run, not after, ensures your labeling matches actual card position rather than relying on memory after the cards are collected and they all look similar.
How do I store water-sensitive paper cards before use?
Keep cards sealed in their original foil pouch in a cool, dry location away from spray chemicals, solvents, and high humidity. Don't store them in the cab of a tractor or in a spray room where vapors accumulate. Cards have a shelf life of roughly two to three years when stored properly. Check the manufacturer's date stamp if cards have been in storage longer than one season before relying on them for a calibration assessment.
Sources
- Syngenta / TeeJet Technologies, Water Sensitive Paper product documentation: WSP cards use bromocresol green dye that reacts with water droplets to produce blue spots on a yellow background, allowing visual coverage assessment
- US EPA, Worker Protection Standard 40 CFR Part 170: The EPA Worker Protection Standard requires pesticide application records to be kept for two years and requires applications consistent with product labeling
- UC Davis Cooperative Extension, Botrytis and Canopy Management in California Vineyards: UC Davis Cooperative Extension research found inconsistent canopy penetration was a primary contributor to failed fungicide programs in California coastal vineyards
- Cornell University, New York State IPM Program, Viticulture Resources: Cornell viticulture extension recommends a minimum of two sampling locations per block for routine calibration and five or more for a formal audit, and has published a DepositScan protocol for grapevine spray assessment
- Washington State University Extension, Spray Technology and Pesticide Application Resources: WSU Extension cites 20 to 30 droplets per square centimeter as the minimum droplet density target for fungicide coverage on grapevine foliage, and 25-75 percent coverage as the general target range
- TeeJet Technologies / Spraying Systems Co., Spray Application Technology Resources: WSP card packs of 100 typically cost $15 to $25 and nozzles should be checked for output volume and pattern at least every 25 acres of use
- California Department of Pesticide Regulation, Pesticide Use Reporting: California requires pesticide use reports to be submitted to the county agricultural commissioner within specified timeframes following application
- USDA Agricultural Research Service, DepositScan Software: USDA-ARS developed DepositScan as a free program to analyze scanned WSP card images and return percent coverage and droplet count data
- UC Davis Integrated Pest Management Program, Pesticide Application Methods: Ambient humidity above 65-70 percent can cause background staining on WSP cards from moisture alone, compromising card reliability for coverage assessment
- Cornell University, New York State IPM Program, Viticulture Resources: Cornell and UC Davis extension resources describe using both WSP cards and tracer dye methods as complementary approaches: cards for immediate gross coverage assessment, tracer dyes for detailed spatial distribution analysis
- WSU Extension, Viticulture and Enology Program: WSU extension spray technology diagnostic guides describe how WSP card patterns such as satellite droplets or irregular spotting indicate specific equipment problems including excessive pressure or worn nozzles
Last updated 2026-07-10