Grapevine leafroll disease distribution map: where it spreads and why it matters

TL;DR
- Grapevine leafroll disease is found in virtually every wine-producing country, driven mostly by Grapevine leafroll-associated virus 3 (GLRaV-3) and spread by mealybugs and soft scale insects.
- Distribution maps built from survey data show hotspots in California, the Pacific Northwest, New Zealand, South Africa, and Mediterranean Europe.
- Early detection and certified planting material are the only reliable controls.
What is grapevine leafroll disease and how widespread is it?
Grapevine leafroll disease (GLD) is a virus complex, and it ranks among the most economically damaging diseases of Vitis vinifera anywhere grapes grow. The causal agents are a group of related viruses called Grapevine leafroll-associated viruses (GLRaVs), numbered 1 through 13, though GLRaV-1 and GLRaV-3 do the most commercial damage. GLRaV-3 alone has turned up on every continent where grapes are grown commercially.
The scale is not small. A 2012 review published in Plant Disease estimated that leafroll costs the California wine grape industry roughly $25,000 to $40,000 per hectare over a vineyard's productive life, depending on variety and infection level [1]. That figure reflects both yield loss (typically 20 to 40% in infected blocks) and delayed sugar accumulation that forces growers to either pick underripe or wait and lose fruit quality.
Every major producing nation has confirmed presence. France, Italy, Spain, Portugal, Germany, South Africa, Chile, Argentina, New Zealand, Australia, and all major U.S. growing states. The disease doesn't spare cool climates or warm ones. It shows up in Burgundy and in Lodi.
That ubiquity is exactly what makes distribution mapping useful. The question stopped being "does leafroll exist here" and became "how dense is it, which virus species, and which vectors are carrying it."
How are grapevine leafroll disease distribution maps built?
A leafroll distribution map is only as good as the survey behind it. The best regional maps combine three data layers: serological or PCR-based laboratory testing of vine samples, georeferenced field symptom surveys, and insect vector population monitoring. Strip away any one of those and the map starts lying to you.
Field symptom surveys are the cheapest starting point. Trained scouts walk rows in late summer and flag vines showing the classic interveinal reddening in red varieties or a subtle rolling and chlorosis in white varieties. Those GPS coordinates get plotted on a vineyard map. Washington State University Extension has published standardized scouting protocols for this, noting that symptom surveys work best between veraison and harvest when visual signals are strongest [2].
Laboratory confirmation matters because leafroll symptoms overlap with other problems: nutrient deficiency, other viruses, heat stress, even certain rootstock incompatibilities. UC Davis Foundation Plant Services (FPS) uses ELISA testing and RT-PCR to confirm virus species in submitted samples, and their survey data feeds into regional understanding of which GLRaV types dominate in California [3].
Vector surveys add the third layer. Entomologists place sticky traps and inspect vine bark to map where vine mealybug (Planococcus ficus) or grape mealybug (Pseudococcus maritimus) populations are building. Because mealybugs move infection from vine to vine, their distribution predicts where leafroll spreads next. Some regional maps now layer vector density over virus incidence to produce a combined risk surface.
The resulting maps get produced at county or sub-appellation scale by university extension services, state agriculture departments, or industry-funded grower commissions. They're almost never static. Good programs resurvey the same blocks every two to three years to track movement.
Which U.S. wine regions show the highest leafroll incidence on current maps?
California, Washington, and Oregon have the most thoroughly mapped leafroll situations in the U.S., largely because those states have the extension infrastructure and industry funding to sustain multi-year surveys.
In California, the Napa Valley has some of the most extensively documented infection history. A vineyard survey published by UC Cooperative Extension found that in some Napa blocks, GLRaV-3 incidence exceeded 50% of sampled vines in older, replanted vineyards where mealybug pressure had gone unmanaged for years [3]. Sonoma County, Paso Robles, and the Central Valley all show meaningful incidence, though the Central Valley's warmer temperatures appear to reduce mealybug survival enough to slow spread somewhat. Vineyards near Paso Robles wineries in San Luis Obispo County deal with a mix of both vine mealybug and grape mealybug pressure, which complicates management.
Washington State is a different story. GLRaV-3 is confirmed present, but vine mealybug (the more aggressive spreader) has a patchy distribution in the Columbia Valley. WSU Extension's ongoing surveys show the risk is highest in vineyards next to already-infested blocks, and the agency has mapped mealybug-confirmed counties to help growers in clean areas prioritize prevention [2].
Oregon's Willamette Valley has documented leafroll mainly through certification program rejections and targeted surveys, with GLRaV-1 and GLRaV-3 both confirmed. The state's small acreage and strong nursery certification culture have kept incidence lower than California, but it's present.
New York's Finger Lakes and Long Island regions have confirmed leafroll presence, with Cornell's grape program tracking it, though large-scale georeferenced mapping is less developed than on the West Coast [4].
What does the global distribution map of leafroll look like?
Globally, leafroll is present wherever Vitis vinifera grows commercially. The International Council for the Study of Virus and Virus-like Diseases of the Grapevine (ICVG) has documented confirmed presence in more than 60 countries. The practical map is simple: assume presence unless a specific survey with laboratory confirmation says otherwise.
South Africa is a country where GLRaV-3 spread has been studied hard. Research from Stellenbosch University, tracking spread in Western Cape vineyards from the early 2000s, showed vine mealybug could move GLRaV-3 from an infected vine to adjacent vines fast enough to double block-level incidence within three to five years in unmanaged situations [5]. That work underpins much of the global understanding of secondary spread rates.
New Zealand, particularly Hawke's Bay and Marlborough, has run national surveys and found GLRaV-3 in most producing regions. The New Zealand biosecurity framework treats leafroll as a managed pest, and growers there carry mandatory reporting obligations for some virus detections.
Europe is complicated by the sheer age of its vineyards. Many old-vine parcels in Burgundy, the Rhone, and Rioja were planted before certification programs existed, and latent infections are common. France's ANSES (national food safety agency) tracks virus status in certified nursery material but doesn't publish a vineyard-level incidence map for commercial blocks.
Chile and Argentina, with their geographic isolation and historically strong quarantine programs, have lower confirmed incidence than California or South Africa, but both have documented GLRaV-3 in commercial vineyards. Argentina's INTA (national agricultural research institute) has published regional survey data showing presence in Mendoza.
What vectors drive the spread shown on leafroll distribution maps?
The distribution map you're looking at is, in large part, a map of mealybug and soft scale movement. Leafroll viruses don't spread through soil, tools, or pruning wounds in any way that matters epidemiologically. They need a vector to move between vines.
Vine mealybug (Planococcus ficus) is the most efficient and aggressive vector of GLRaV-3 in California and worldwide. It's a semi-persistent vector, meaning the insect can acquire the virus within minutes of feeding and transmit it for hours, but it doesn't hold the virus between molts the way a persistent vector would. In the field, that still produces rapid block-level spread when populations run high.
Grape mealybug (Pseudococcus maritimus) and longtail mealybug (Pseudococcus longispinus) also transmit GLRaV-3, though less efficiently than vine mealybug. Soft scale insects, particularly European fruit lecanium (Parthenolecanium corni) and cottony cushion scale, have been documented as vectors of some GLRaV types too.
Here's the practical read. Where you see GLRaV-3 spreading fast, new vines infected in patterns radiating from a point source, you're almost certainly looking at an active vine mealybug infestation. Where you see diffuse, low-level incidence across a block with no clear pattern, you're more likely looking at infected planting material distributed at establishment rather than insect-driven secondary spread.
Cornell's grape pathology program published guidance noting that "the rate of spread within a vineyard is closely linked to mealybug population density and ant activity," since ants tend mealybugs and physically move them between vines [4]. Ant management has become a real part of leafroll spread prevention in Napa and Sonoma.
How do you read a vineyard-level leafroll map for your own block?
A regional distribution map tells you your risk environment. A vineyard-level map tells you what's actually happening in your rows. Every manager who suspects leafroll should be building the second type, even if it's just a paper spreadsheet tied to a row-and-vine numbering system.
Start at veraison. Walk every row in red-variety blocks and flag vines with interveinal reddening that isn't explained by nitrogen deficiency or another obvious cause. In white varieties, look for downward leaf rolling and reduced vine vigor. Mark each flagged vine by GPS coordinate or by row and vine number referenced to your block map.
Send tissue samples from a representative subset (flagged vines plus some apparently healthy neighbors) to a certified laboratory for RT-PCR testing. UC Davis FPS, Agri-Analysis, and several commercial labs test for the full GLRaV panel. Expect results in two to four weeks and costs of roughly $20 to $50 per sample depending on panel size [3].
Plot confirmed positives on your block map. Look at the pattern. Clustered positives radiating from one area suggest active mealybug-driven spread from an infection source, maybe an old vine or a block edge next to an infested neighbor. Scattered positives with no spatial pattern suggest infected planting material at establishment.
That distinction changes everything about your response. Active secondary spread calls for urgent mealybug management and may justify roguing infected vines to slow new infections. Residual infected-at-planting material is a slower problem: you can monitor incidence over time and plan a phased replant.
For operations tracking multiple blocks across multiple seasons, this is the kind of longitudinal spatial data that field record systems handle well. Platforms like VitiScribe let you log geo-tagged observations, attach lab results, and compare incidence maps year over year so you can actually see whether a mealybug program is working.
What are the economic costs shown in leafroll impact studies?
The economic data on leafroll losses is real, and it's not subtle. The numbers justify serious management spending.
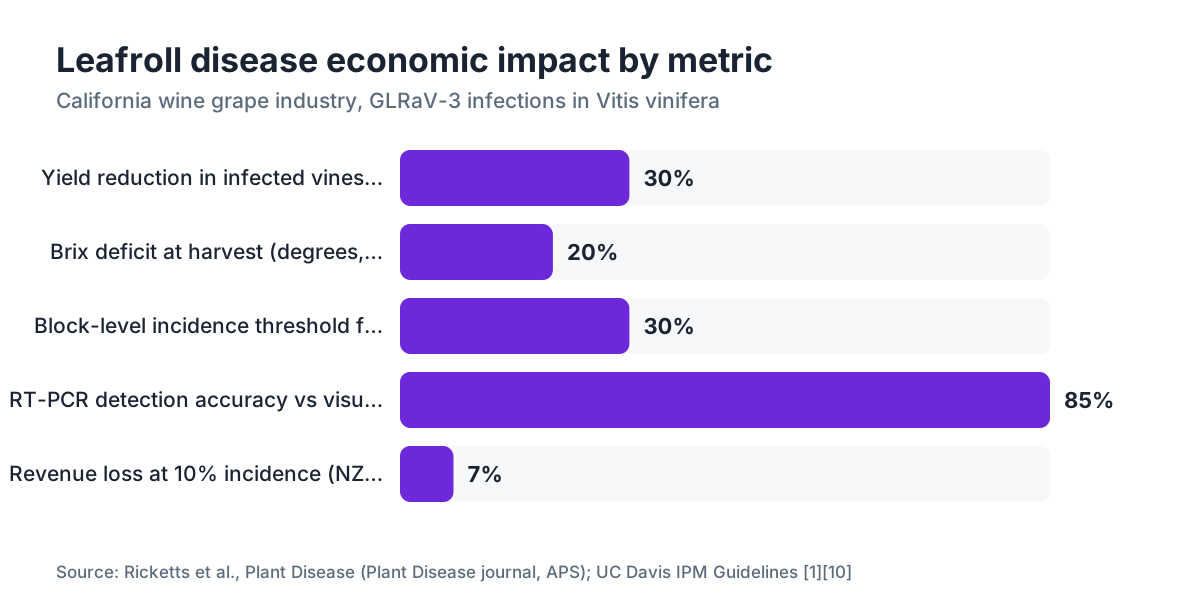
The most-cited California study, published in Plant Disease in 2012, put the cost at $25,000 to $40,000 per hectare in net present value losses over a 25-year vineyard life, accounting for yield reduction, quality downgrade, and early replanting [1]. A separate analysis from Lincoln University in New Zealand estimated that a Sauvignon Blanc block at 10% infection incidence loses roughly 7% of revenue annually, scaling up nonlinearly as incidence climbs past 30% [6].
Yield loss numbers vary by variety, virus strain, and rootstock, but the consistent finding across studies is that infected vines produce 20 to 40% less than healthy neighbors, and the fruit carries measurably lower Brix at harvest, often by 1 to 3 degrees [1]. For red varieties, anthocyanin content drops in infected vines, which hits both color and perceived quality directly.
Replanting costs pile on. When you rogue and replant infected vines, you're looking at three to five years of lost production from those positions plus establishment cost, which runs $15,000 to $30,000 per acre in California depending on land prep, trellis, irrigation, and plant material. If mealybug pressure isn't controlled, the new vines can get infected before they reach full production.
The table below pulls key economic impact data from primary studies.
| Metric | Range | Source |
|---|---|---|
| NPV loss per hectare (CA) | $25,000-$40,000 | Ricketts et al., 2015, Plant Disease [1] |
| Annual revenue loss at 10% incidence (NZ) | ~7% | Lincoln University study [6] |
| Yield reduction in infected vines | 20-40% | Multiple studies |
| Brix deficit at harvest | 1-3 degrees | Multiple studies |
| Replanting cost per acre (CA) | $15,000-$30,000 | UC Cooperative Extension [3] |
How do certified planting material programs help contain leafroll spread on distribution maps?
Certified planting material is the single most effective tool for keeping leafroll out of a new vineyard. Period. Everything else is slower, more expensive, or less reliable.
UC Davis Foundation Plant Services tests all foundation plant material for GLRaVs and other viruses before it enters the certified nursery supply chain [3]. Nurseries in the California Department of Food and Agriculture (CDFA) Grapevine Registration and Certification (R&C) Program must use FPS-certified foundation stock and follow testing and inspection protocols. CDFA runs this program under the authority of Food and Agricultural Code sections 5000 to 5065.
Washington State has a similar framework through the WSU Clean Plant Network Northwest (CPNN), which keeps heat-treated, foundation-level clean plant material for over 1,000 grapevine selections and tests them for more than 60 viruses and virus-like agents [2]. The CPNN is part of the USDA-funded National Clean Plant Network, which also supports clean plant programs at Cornell for eastern varieties.
The catch is that certified material planted into a vineyard can still get infected by mealybugs moving in from adjacent blocks. Certification gets you a clean start. It doesn't create permanent immunity. That's why certified plant material plus mealybug monitoring and control is the only approach that keeps incidence low on long-term distribution maps.
For growers sourcing material: always ask nurseries for documentation of their certification status. A legitimate California nursery in the R&C Program can show you its CDFA registration number. If it can't, or if the price looks suspiciously low, walk away.
What do WSU, UC Davis, and Cornell recommend for leafroll monitoring?
These three extension programs have produced the most useful guidance available to U.S. growers, and their recommendations broadly agree even though regional conditions differ.
WSU Extension's recommendations for Washington lean hard on vine mealybug exclusion and monitoring, since the insect is still spreading into new areas of the Columbia Valley. The guidance calls for visual surveys for mealybug crawlers on trunk tape traps, targeted sampling in known hotspots, and strict movement controls on equipment that has worked in infested blocks [2]. For leafroll specifically, WSU advises annual symptom surveys and RT-PCR confirmation of any suspicious vines.
UC Davis Integrated Pest Management includes leafroll in its statewide pest management guidelines and recommends certified plant material, mealybug monitoring starting in spring, and roguing of confirmed infected vines when incidence sits below roughly 20% (above that threshold, whole-block replanting is often more economical) [10]. UC Davis FPS also publishes annual updates on the virus status of its foundation block, publicly accessible on its website.
Cornell's New York State IPM program has published leafroll fact sheets for Finger Lakes and Long Island growers, noting that eastern grape mealybug pressure differs from western regions but that the core monitoring approach (symptom scouting plus lab confirmation plus vector management) is the same [4].
All three programs agree on one point that gets ignored constantly: symptom-based scouting alone misses latent infections. Vines can carry GLRaV-3 for one to three years before showing symptoms, meaning a clean-looking block can hide 10 to 15% infection incidence that never shows up on a visual survey. Budget for some laboratory testing of asymptomatic vines, especially in blocks next to known infected material.
What is the role of regulatory and compliance frameworks in leafroll spread management?
Leafroll viruses are not federally regulated quarantine pests in the U.S., which means there's no mandatory eradication program the way there is for Pierce's disease. The management framework is mostly voluntary, certification-based, and incentive-driven.
At the federal level, USDA's Animal and Plant Health Inspection Service (APHIS) includes leafroll testing requirements for imported grapevine material under 7 CFR Part 319, which restricts importation of plant material that could carry regulated pests [7]. This affects growers and nurseries who want to import selections not in the domestic clean plant network.
At the state level, California's CDFA Grapevine R&C Program is the main regulatory mechanism. Participation is technically voluntary for nurseries selling within California, though most legitimate commercial nurseries participate because buyers increasingly require it. CDFA conducts certification inspections and can revoke nursery registration for violations.
For field workers surveying or managing leafroll, the EPA Worker Protection Standard (WPS) under 40 CFR Part 170 applies when pesticides get used for mealybug control as part of a leafroll program [8]. WPS requires training, restricted-entry interval compliance, and access to safety data for any workers handling or working in treated areas. That's compliance paperwork vineyard managers need to track alongside their spray records, regardless of whether the product being applied targets leafroll vector control or something else.
Record-keeping systems that log spray applications, field observations, and lab results in one place make it much easier to demonstrate WPS compliance during an inspection. That's a practical argument for keeping field operations records organized, more than a nice-to-have.
How can you use leafroll distribution maps to make replanting decisions?
A distribution map, whether regional or vineyard level, is a planning document as much as a diagnostic one. The spatial pattern of infection tells you something specific about your options.
If your vineyard-level map shows a cluster of infected vines in one corner of a block, with lower incidence elsewhere, that suggests spread is still active and likely mealybug-driven. The argument for roguing the cluster and treating aggressively for mealybugs is strong: you might salvage the rest of the block for another five to eight years. Pull those vines, treat the soil perimeter with an approved systemic insecticide, and replant with certified material in two to three years once you're confident the mealybug population is down.
If the map shows diffuse infection across the whole block with no spatial pattern, you're probably looking at infected planting material from the original establishment. Roguing individual vines becomes economically questionable because there's no clear infection source to contain. At that point, the more honest conversation is about setting a block-level economic threshold: at what incidence percentage does the revenue loss from infection exceed the cost of replanting? The Stellenbosch research and California studies put that threshold somewhere around 25 to 35% for most premium red varieties, but it depends heavily on your production economics [5].
Regional distribution maps give you the second piece of the puzzle: what's the mealybug pressure in your area likely to be after you replant? If neighboring operations are reporting vine mealybug and you sit in a confirmed spread zone, your new vineyard is under pressure from day one. That raises the value of perimeter monitoring, ant management, and possibly a prophylactic soil drench of an approved systemic at planting. UC Davis guidelines address this replanting-into-pressure scenario specifically [10].
For growers managing multiple vineyard blocks, keeping all of this in one place, from lab results to spray logs to scouting notes, is what lets you decide with data rather than memory. That's where tools like VitiScribe earn their keep: not as a compliance checkbox, but as the thing that keeps your multi-year block history organized enough to inform a $30,000-per-acre replant call.
Are there thermal or satellite-based methods for mapping leafroll remotely?
Yes, and this is one of the genuinely promising areas of applied research, though it can't replace ground-truthed surveys yet.
Several research groups have tested hyperspectral and multispectral remote sensing to detect leafroll symptoms from drone or satellite imagery. The physiological basis is real. GLRaV-infected vines have measurably different chlorophyll content and anthocyanin distribution than healthy vines, and those differences produce detectable spectral signatures, particularly in the red-edge wavelengths around 700 to 730 nm.
A study from the University of Adelaide and CSIRO, published around 2018 to 2019, showed drone-mounted hyperspectral sensors could detect leafroll-symptomatic vines with accuracy above 80% when flown at veraison in red varieties [9]. The limit is that detection works only during the symptom expression window (roughly veraison to harvest) and only for symptomatic, visually expressive infections. Latent infections in white varieties are essentially invisible from the air.
Satellite approaches using Sentinel-2 imagery have been tested at vineyard block scale in South Africa and parts of France. The spatial resolution (10 meters per pixel for Sentinel-2's best bands) rules out vine-by-vine detection, but it can flag blocks or zones with elevated infection pressure for ground-level follow-up.
The practical state of play for most growers: remote sensing for leafroll is a triage tool, not a substitute for RT-PCR confirmation. If you have access to a drone service that can fly multispectral imagery at veraison, the resulting map tells you where to spend your sampling budget. It won't tell you which GLRaV species you're dealing with or the exact incidence percentage.
Frequently asked questions
Is grapevine leafroll disease present in every wine-growing country?
Effectively yes. The International Council for the Study of Virus and Virus-like Diseases of the Grapevine (ICVG) has documented confirmed GLRaV presence in more than 60 countries. Every major wine-producing nation, including France, Italy, Spain, the U.S., South Africa, Chile, Argentina, New Zealand, and Australia, has confirmed leafroll incidence. Assuming presence and managing accordingly is the correct default for any commercial vineyard.
What are the visual symptoms I should look for when doing a leafroll field survey?
In red-fruited varieties, look for interveinal reddening that starts at leaf margins and moves inward, with veins staying green longer. Leaves often roll downward at the margins. In white varieties, symptoms are subtler: downward leaf rolling, mild chlorosis, and slightly reduced vigor. Symptoms are most visible from veraison through harvest. Latent infections in either color class show no visible symptoms at all, which is why lab testing of asymptomatic vines matters.
Which mealybug species spread leafroll disease the fastest?
Vine mealybug (Planococcus ficus) is the most efficient vector for GLRaV-3, the most economically damaging leafroll strain. It can acquire the virus in minutes and transmit it for hours. Grape mealybug (Pseudococcus maritimus) and longtail mealybug (Pseudococcus longispinus) also transmit GLRaV-3 but less efficiently. Soft scale insects transmit some GLRaV types too. Controlling vine mealybug is the most direct lever for slowing leafroll spread within a block.
How accurate is visual scouting for leafroll compared to lab testing?
Visual scouting misses latent infections entirely and can mistake other disorders for leafroll. Studies suggest vines can carry GLRaV-3 for one to three years before showing clear symptoms. In a block with 15% true incidence, a symptom-only survey might catch 8 to 10%, leaving the rest undetected. RT-PCR testing is the gold standard for confirmation. Symptom scouting is valuable for targeting your sampling budget, but it can't replace lab confirmation for management decisions.
What does leafroll disease cost per hectare, and where does that number come from?
The most widely cited figure is $25,000 to $40,000 per hectare in net present value losses over a 25-year vineyard life in California, from a study by Ricketts et al. published in Plant Disease in 2012 and updated in later analyses. The number includes yield reduction (typically 20 to 40%), quality downgrade from lower Brix and reduced anthocyanins, and early replanting costs. The range reflects variation in variety, virus strain, market price, and mealybug pressure.
How do I get certified leafroll-free planting material in California?
Source from a California Department of Food and Agriculture Grapevine Registration and Certification Program nursery. These nurseries use foundation stock from UC Davis Foundation Plant Services, which tests for GLRaVs and other viruses. Ask for the nursery's CDFA registration number before buying. The USDA National Clean Plant Network also maintains clean plant sources through WSU's Clean Plant Network Northwest for over 1,000 selections. Certification guarantees the material is virus-free at time of sale, not permanently immune to field infection.
Can I use drone imagery to map leafroll in my vineyard?
Drone-mounted multispectral or hyperspectral sensors can detect symptomatic leafroll infections in red varieties at veraison with roughly 80% accuracy, based on research from the University of Adelaide and CSIRO. The approach doesn't work well for white varieties or latent infections. Use it as a triage tool to prioritize ground-level sampling, not as a substitute for RT-PCR confirmation. Spatial resolution limits vine-level detection from satellite imagery; drones are more practical at block scale.
At what infection incidence does it make economic sense to replant a block rather than rogue individual vines?
Work from Stellenbosch University and UC Davis suggests the economic tipping point is roughly 25 to 35% block-level incidence for premium red varieties, though the exact threshold depends on your production economics, grape price, and mealybug pressure. Below that range, targeted roguing combined with mealybug control can extend block life economically. Above it, whole-block replanting typically returns more over the long run despite the three-to-five-year establishment gap.
Does the EPA Worker Protection Standard apply to mealybug spray programs used for leafroll control?
Yes. Any pesticide application for mealybug control in a vineyard falls under the EPA Worker Protection Standard (40 CFR Part 170), which requires worker training, restricted-entry interval compliance, and access to safety data sheets. This applies whether the pesticide is an organophosphate, a neonicotinoid soil drench, or horticultural oil. Spray records must document the product, rate, date, REI, and treated area. Keep these records for both compliance and WPS inspection documentation.
Is leafroll disease a federally regulated quarantine pest in the United States?
No. GLRaVs are not federally regulated quarantine pests under USDA APHIS jurisdiction for domestic spread. There is no mandatory eradication program. USDA APHIS does regulate imported grapevine material under 7 CFR Part 319 and requires virus testing for international plant movement. Domestically, management relies on voluntary certification programs (California's CDFA R&C Program, WSU's Clean Plant Network Northwest) and state-level nursery inspection frameworks, not federal eradication orders.
Which GLRaV type is most commonly found on distribution maps in the U.S.?
GLRaV-3 dominates in California, Washington, Oregon, and New York, consistent with global patterns. GLRaV-1 is the second most common type in many regions. GLRaV-2 shows up too but has a different epidemiology, spreading through grafting rather than insect vectors in most confirmed cases. Some California blocks carry multiple GLRaV types at once, which complicates management because different types may have different vector relationships and symptom expression.
How often should I resurvey my vineyard for leafroll to keep my block map current?
Annual symptom surveys at veraison are the practical minimum if you have known mealybug pressure or confirmed leafroll in your blocks or neighboring operations. In lower-risk situations with no recent detections and good mealybug monitoring, biennial surveys are defensible. Resurvey more often (every row, every vine) when tracking the edge of an active spread cluster to see if your interventions are working. Confirm a sample of flagged vines by lab at least every other survey cycle.
Can ants make leafroll spread faster in my vineyard?
Yes, indirectly. Ants tend mealybug colonies for honeydew and physically move mealybug crawlers between vines, which speeds up spread of any mealybug-vectored virus including GLRaV-3. Cornell's grape program has published guidance noting this relationship. Managing ant populations through trunk-applied sticky barriers or approved bait products is a legitimate part of mealybug programs in Napa and Sonoma, and it can meaningfully slow leafroll spread within a block.
Where can I access public leafroll distribution map data for my region?
UC Davis Foundation Plant Services publishes survey data for California. WSU Extension posts county-level mealybug and virus survey data for Washington. Cornell's New York State IPM program has fact sheets covering regional status. For Pacific Northwest regional data, the Clean Plant Network Northwest at WSU keeps records. No single national database aggregates all state survey data into one map. Your state's department of agriculture plant health division may also have survey records available by public records request.
Sources
- Ricketts et al., Plant Disease, 'The Economic Impact of Grapevine Leafroll Disease on Vitis vinifera cv. Cabernet Sauvignon Vineyards in California': Leafroll disease costs the California wine grape industry roughly $25,000 to $40,000 per hectare in net present value losses over a 25-year vineyard life
- Washington State University Extension, Grapevine Virus Management: WSU Extension recommends annual symptom surveys between veraison and harvest and has published mealybug distribution data by county in Washington State
- UC Davis Foundation Plant Services, Grapevine Certification Program: UC Davis FPS uses ELISA and RT-PCR to confirm GLRaV species in submitted samples and reports that GLRaV-3 incidence has exceeded 50% in some older Napa Valley blocks
- Cornell University New York State IPM Program, Grapevine Leafroll Disease Fact Sheet: Cornell notes that rate of leafroll spread within a vineyard is closely linked to mealybug population density and ant activity, since ants tend mealybugs and move them between vines
- Stellenbosch University / South African Journal of Enology and Viticulture, studies on GLRaV-3 secondary spread rates: Stellenbosch University research showed vine mealybug could double block-level GLRaV-3 incidence within three to five years in unmanaged Western Cape vineyards
- Lincoln University New Zealand, economic analysis of leafroll in Sauvignon Blanc: Lincoln University estimated that a Sauvignon Blanc block at 10% infection incidence loses roughly 7% of revenue annually, scaling up nonlinearly at higher incidence
- U.S. EPA, Worker Protection Standard, 40 CFR Part 170: EPA Worker Protection Standard requires training, restricted-entry interval compliance, and safety data access for agricultural workers in pesticide-treated areas
- University of Adelaide / CSIRO, hyperspectral remote sensing of leafroll disease in grapevines: Drone-mounted hyperspectral sensors detected leafroll-symptomatic vines with accuracy above 80% when flown at veraison in red varieties
- UC Davis Integrated Pest Management Program, Grape Pest Management Guidelines: UC Davis IPM recommends roguing confirmed infected vines when incidence is below roughly 20%, above which whole-block replanting is often more economical
- California Department of Food and Agriculture, Grapevine Registration and Certification Program: CDFA manages the Grapevine R&C Program under Food and Agricultural Code sections 5000-5065, requiring participating nurseries to use FPS-certified foundation stock
- USDA National Clean Plant Network, Clean Plant Network Northwest at WSU: WSU Clean Plant Network Northwest maintains heat-treated, foundation-level clean plant material for over 1,000 grapevine selections tested for more than 60 viruses
Last updated 2026-07-09