How to compare pesticide efficacy data across vineyard blocks
TL;DR
- Comparing pesticide efficacy across vineyard blocks means controlling for the block-level variables (variety, rootstock, row orientation, vine age, spray timing, application rate, disease pressure) before you draw a single conclusion.
- Skip that discipline and you're reading noise.
- Start with standardized records, use percent disease incidence and severity as your primary metrics, and run at least a basic paired comparison before you change any program.
Why is comparing efficacy data across blocks so hard to get right?
Every vineyard block is its own experiment, and almost nobody designed it as one. Row orientation changes canopy dryness. Rootstock affects vine vigor and how fast a canopy closes. Variety is the obvious factor, but two blocks of the same variety planted in different years have different vine ages and root depths that shift how they take up systemic fungicides. Layer on variable equipment calibration, operator speed, and weather windows that differ by a few hours, and you get what looks like an efficacy difference but is really a confounding variable wearing a disguise.
The core problem is structural. Block-level records were never built to be compared head-to-head. They exist to satisfy spray record requirements under 40 CFR Part 170, the EPA Worker Protection Standard [1]. The data is shaped around compliance, not experimental rigor. If you want a comparison that means something, you have to retrofit a little experimental thinking onto your record-keeping.
Nobody has clean, controlled efficacy data from real commercial vineyards. The closest thing is university trial data from replicated plots, and even UC Cooperative Extension acknowledges that results from research trials may not translate directly to commercial production settings [2]. That's an honest caveat, and it matters. Commercial block comparisons are useful for decisions, not for publication-grade conclusions.
Admit that limitation first. Then build the best system you can inside it.
What variables do you need to record before you can compare blocks?
Before you touch a single efficacy number, you need a covariate record for each block. Think of it as the block's profile card. Without it, any comparison is noise dressed up as a result.
Here are the variables that move the needle most, roughly ordered by how hard they swing results:
| Variable | Why it matters | How to record it |
|---|---|---|
| Variety | Disease susceptibility differs sharply (Chardonnay vs. Cabernet Sauvignon vs. hybrid varieties) | Block map, permanent record |
| Vine age | Older vines have larger trunk wood, different bark microclimate, different systemic uptake | Planting year in block log |
| Rootstock | Affects vigor, canopy density, water stress | Block map or nursery records |
| Row orientation | N-S rows dry faster after rain than E-W rows | Measured once, GPS or aerial |
| Trellis/canopy system | VSP vs. Scott Henry vs. head-trained changes spray penetration a lot | Block log |
| Irrigation regime | Water stress changes stomatal behavior and cuticle thickness, both relevant to fungicide uptake | Irrigation log per block |
| Spray equipment | Airblast vs. targeted; nozzle type; gallons per acre | Spray record per application |
| Spray timing (BBCH stage) | An application at BBCH 12 vs. BBCH 57 protects different things even on a similar calendar date | Spray record + growth stage log |
| Application rate | Product per acre, more than product per water volume | Spray record per application |
| Rainfall between applications | Drives disease pressure and washoff of contact materials | Weather log or nearest CIMIS/AWIS station |
WSU's wine grape pest management guide flags spray timing relative to growth stage as the single biggest source of trial-to-trial variation in its fungicide efficacy work [3]. That lines up with what the field teaches you. A mancozeb application at pre-bloom and one at post-fruit-set are practically different products in terms of what they protect.
Log all of this in a structured format, not a text note. Pull spray records from paper logs and you'll lose half this information by comparison time. Digital record systems built for vineyard compliance (see the block-record features in VitiScribe) let you attach growth stage and equipment notes to each spray event, which makes retrospective comparison much faster.
What efficacy metrics should you actually measure in each block?
Two numbers do most of the work: percent disease incidence and percent disease severity. Incidence is the share of sampling units (clusters, leaves, or shoots) showing any symptoms. Severity is the share of tissue on a symptomatic unit that's affected. They tell different stories. High incidence with low severity means the disease got into the block but the program slowed its spread. Low incidence with high severity on the infected units means something else: the material held the line but missed the units exposed early, which points at a timing problem.
For powdery mildew, the standard sampling protocol from UC IPM recommends rating at least 10 clusters per block at veraison on a 0-5 severity scale, then converting to percent severity [4]. Cornell's viticulture program uses a similar approach but adds a leaf rating at shoot emergence and again at bloom [5]. You don't have to pick one. The thing that matters is using the same protocol in every block you compare. Mix a cluster-only rating in one block with a leaf-plus-cluster rating in another and the numbers stop meaning anything.
Botrytis ratings are most useful at harvest. Rate clusters for bunch rot incidence (any visible Botrytis) and severity (percent of cluster affected). Keep harvest records and spray records together so you can trace a disease outcome back to program decisions made six to eight weeks earlier.
Trunk diseases are a different clock. For Eutypa and Botryosphaeria, efficacy comparison runs for years. A single season tells you almost nothing. Plan for at least three years of consistent wound treatment and symptom tracking before you decide which pruning-wound protectant won.
A word on yield and quality as efficacy proxies. They're tempting because you already have the data. Resist. Too many non-spray factors drive yield and Brix for those numbers to be reliable efficacy signals. Use them as supplementary context, never as your headline metric.
How do you set up a block comparison that's actually fair?
A fair comparison holds the key covariates constant or accounts for them out loud. In practice that means one of three approaches, and they're not equally good.
The cleanest approach: find two blocks that genuinely match on the big variables (same variety, similar age, same trellis, similar aspect) and run different spray programs in each on purpose. This is a managed comparison, and it's the closest you'll get to an on-farm trial without a university partner. Run it for at least two seasons, because year-to-year disease pressure can easily drown out a one-year result.
The common approach: retrospective comparison of existing blocks that happen to run different programs. Here you work with whatever data you have, so be honest about the holes. If Block A got three more fungicide applications than Block B, but Block A is Chardonnay and Block B is Cabernet Franc, you cannot separate variety susceptibility from application frequency. Write that down. Good field notes name their confounds. They don't pretend the data is cleaner than it is.
The least satisfying approach, and sometimes the only one available: single-block year-over-year. Same block, same variety, program A in year 1 against program B in year 2. The trouble is that year-to-year weather variation is usually bigger than any program difference. Low pressure both years and both programs look great. A wet June in year 2 and program B looks bad even if it's the better material. You can partly compensate by pulling regional disease pressure data from the nearest weather-based disease model (NEWA for the East, UC IPM for California) [6][7] and comparing your incidence against the regional pressure index for that year. That at least tells you whether your result came in a hard year or an easy one.
For any comparison, set a threshold before you look at the data. Something like: a difference of more than 15 percentage points in incidence, sustained across two rating dates, is worth acting on. Pick the threshold after you see the results and you'll talk yourself into changes that aren't warranted.
Do you need statistics, or is eyeballing the numbers good enough?
For most vineyard managers, formal statistics are overkill for routine block comparisons. But you do need one basic check: are the differences you see bigger than the natural sampling variation in your own ratings?
A practical minimum: sample at least 10 clusters per block (20 is better), rate them on the same day by the same rater, and calculate the mean and standard deviation for each block. If the difference between blocks is smaller than one standard deviation within either block, you don't have a signal. You have noise. That's not a statistics degree talking. It's just acknowledging that if your within-block variation is 20% and your between-block difference is 12%, the 12% means nothing.
Two matched blocks make a simple paired t-test easy to run in any spreadsheet. Cornell's IPM program provides worked examples of this approach in its extension materials for apple and grape growers [5]. The math isn't hard. What matters more is that writing down your sampling protocol before you rate forces the consistency that makes the numbers trustworthy.
Statistics genuinely earn their keep in two spots: when you're deciding whether to drop an expensive fungicide from your program, and when you suspect a resistance issue has developed in a particular block. Eyeballing won't cut it there. Call your local cooperative extension farm advisor and ask about a proper strip trial. UC Cooperative Extension advisors in Napa, Sonoma, and the Central Valley counties have set up on-farm trials with growers and can help with design and analysis [2].
How does spray equipment calibration affect your efficacy comparisons?
Equipment differences kill more block comparisons than any other single factor. Two blocks sprayed with the same material at the same labeled rate, one with a well-calibrated airblast sprayer and one with a unit running 15% high on output, are not getting the same dose. The Worker Protection Standard at 40 CFR 170.309 requires applicators to follow label directions, which include rate per acre [1]. Following the label doesn't guarantee the sprayer delivered what you intended.
Calibrate every time you change blocks if row spacing, vine height, or canopy density changes much. Record the calibration result (actual gallons per acre delivered) in the spray log next to the block. Without that number, you can't tell whether a worse outcome in Block B came from the product or the delivery.
Nozzle type matters too. Hollow-cone nozzles give better canopy penetration in dense VSP systems than flat-fan nozzles. If Block A has an open canopy and Block B is a wall of green, even perfect calibration doesn't make them the same target. WSU Extension's spray application guides for wine grapes cover nozzle selection and canopy assessment in detail [3].
Tractor speed is the variable everyone forgets. Operators slow down on the uphill rows and speed up going down. That alone can create a 20-30% swing in actual gallons per acre across a single block, never mind between blocks. If your tractor logs GPS, pull the speed data and compare it to your spray records. If it doesn't, think about it. GPS speed logging paired with flow-meter data gives you the actual delivered rate per sub-block zone, which is the best foundation you can have for reading efficacy data.
How do you account for disease pressure differences between blocks and years?
Disease pressure isn't uniform across a vineyard, and it's nowhere close to uniform across years. A block on the valley floor near a creek sees higher early-season Botrytis pressure than a hillside block with good air drainage. A wet May in one year rewrites everything relative to a dry May the next.
The best tool for normalizing across years is a weather-based disease model. In California, the UC IPM Pest Management Guidelines include disease models for powdery mildew tied to a statewide weather station network [6]. NEWA (Network for Environment and Weather Applications), run through Cornell, covers the eastern U.S. and provides vineyard-specific models for powdery mildew, Botrytis, and downy mildew using the closest weather station [7]. These models won't tell you exactly what happened in your block, but they hand you a regional pressure index you can use to put your incidence data in context.
Say you have two seasons of data. Year 1 was high pressure (the model shows many infection periods) and year 2 was low pressure. You'd expect lower incidence in year 2 no matter what program you ran. Don't hand your new fungicide program the credit for a mild weather year.
For block-to-block differences inside a season, put a small weather station or datalogger in each block you're comparing seriously. The gap in temperature, relative humidity, and leaf wetness duration between a shaded low-lying block and a well-exposed hillside block can be big enough to drive real disease pressure differences on the same property. Onset HOBO loggers or similar units run a few hundred dollars each and pay for themselves fast when you're making multi-thousand-dollar program decisions off block comparisons.
What does a usable block comparison record actually look like?
Here's a concrete example of the minimum data structure for comparing two blocks in the same season:
| Field | Block A | Block B |
|---|---|---|
| Variety | Chardonnay | Chardonnay |
| Vine age (years) | 12 | 14 |
| Rootstock | 3309C | 3309C |
| Row orientation | N-S | N-S |
| Trellis | VSP | VSP |
| Spray program | Sulfur + Luna Privilege (FRAC 7) | Sulfur + Quintec (FRAC 13) |
| Applications (count) | 8 | 8 |
| Avg interval (days) | 10.2 | 10.5 |
| Spray timing aligned to growth stage? | Yes | Yes |
| Calibration confirmed? | Yes, 80 gal/acre | Yes, 82 gal/acre |
| Disease pressure index (NEWA/UC IPM) | Moderate | Moderate |
| PM incidence at veraison (%) | 18% | 11% |
| PM severity on infected clusters (%) | 8% | 6% |
| Rater | Same person | Same person |
| Rating date | August 14 | August 14 |
With this structure, Block B shows meaningfully lower incidence despite near-identical conditions. The difference (7 percentage points in incidence) clears your pre-specified 5-point threshold. That's actionable, and it's defensible. You can put it in front of an agronomist or extension advisor and have a real conversation.
Without this structure, you'd have two numbers and no context. That's where most farm-level comparisons begin and end.
Digital record-keeping platforms built for vineyard operations can pre-structure this comparison for you. VitiScribe links spray records to block profiles and growth stage logs, so pulling this table at the end of a season takes minutes instead of an afternoon in a spreadsheet.
How do FRAC groups and resistance management affect how you read efficacy data?
If a fungicide program is losing efficacy, resistance is the first thing to rule in or out. The Fungicide Resistance Action Committee (FRAC) assigns a mode-of-action code to every registered fungicide [8]. Single-site fungicides (FRAC groups 3, 7, 11, 13) carry higher resistance risk than multi-site materials (FRAC groups M1-M9, which include sulfur and copper).
When efficacy declines in a block over several seasons on the same program, ask one question: has this block seen heavy single-site fungicide pressure for three or more years? If yes, resistance is a serious candidate. The fix is to rotate to a different FRAC group, not to crank up the rate. Increasing the rate against a resistant population buys you label violation risk and zero efficacy gain.
Powdery mildew is the textbook case. QoI fungicides (FRAC 11, strobilurins) have documented resistance in Erysiphe necator across several California wine regions [9]. UC Davis plant pathology researchers published on this in the early 2010s, and the resistance has spread since. If your FRAC 11 applications aren't moving your incidence numbers, that's the likely reason. Switch to FRAC 3 (DMI/sterol biosynthesis inhibitors) or FRAC 7 (SDHI) in rotation with multi-site materials.
For Botrytis cinerea, FRAC 17 (fenhexamid) resistance is documented in California and Pacific Northwest wine grapes [10]. Same answer: rotation plus multi-site materials.
Keep FRAC rotation records at the block level. A block that got FRAC 11 three seasons running is not comparable to a block on a properly rotated program when you're trying to read efficacy differences. The history matters as much as the current season's data.
What do university extension trials actually tell you about which products work?
University efficacy trials are the gold standard for product comparisons. Use them, but know what they are and what they aren't. UC Davis, Cornell, and WSU all run replicated fungicide efficacy trials most seasons for the major diseases of wine grapes [2][3][5]. These trials use small, carefully managed plots with known inoculum, uniform variety and vine age, and hand-application or precisely calibrated equipment. The data is the cleanest you'll ever see.
What a university trial tells you: the relative efficacy ranking of materials under high-pressure conditions. Which FRAC group beats another. Whether a new product is worth trying.
What it doesn't tell you: how that product performs at your application timing, with your equipment, in your canopy, at your spray interval. The translation from trial to farm is real but imprecise.
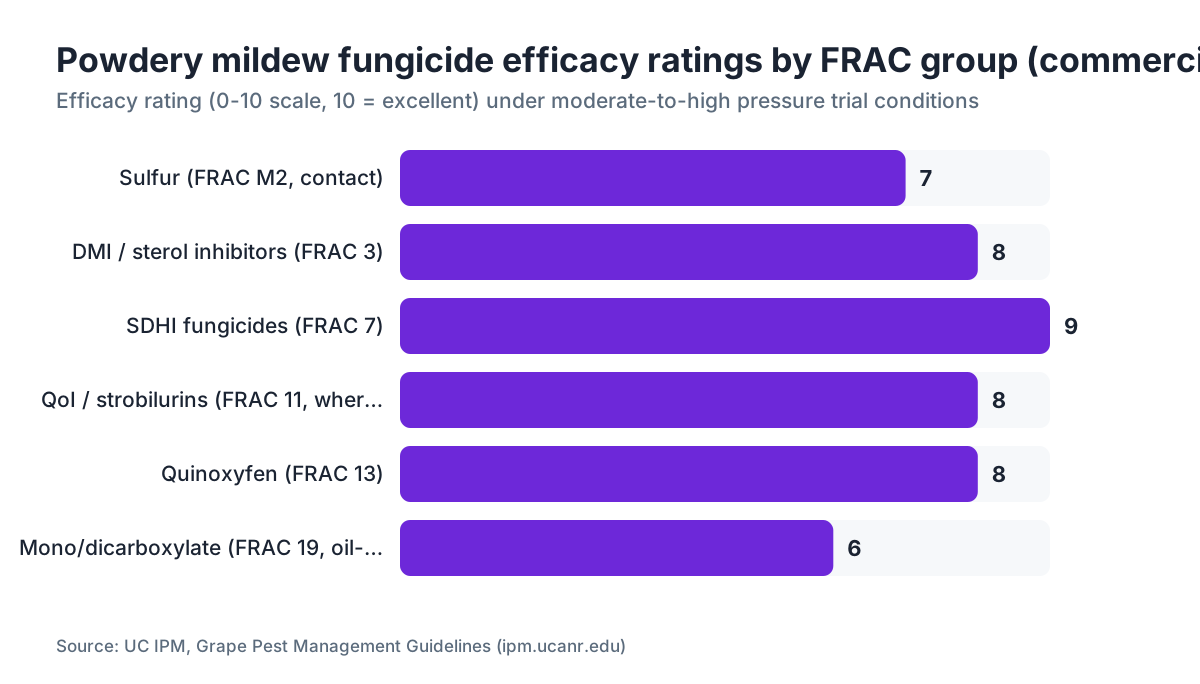
For powdery mildew, UC IPM's fungicide efficacy tables (updated most years in the Grape Pest Management guidelines) rank materials from excellent to poor under trial conditions [4]. WSU publishes similar tables for the Pacific Northwest [3]. Cornell's IPM program publishes the New York and Pennsylvania Pest Management Guidelines, with efficacy tables for powdery mildew, Botrytis, and downy mildew [5]. All three are free online.
The most useful move: treat the university ranking as your starting point for program design, then use your own block-level records to catch deviations from expected performance. If a product UC rates excellent gives you mediocre numbers in your block across two consecutive seasons, that's your cue to investigate. Resistance? Timing? Equipment? Canopy? Don't assume the trial data is wrong. Assume your block has a specific condition that needs diagnosing.
How should your spray records be structured to support efficacy comparisons later?
Most spray record systems are built to satisfy the minimum under 40 CFR Part 170 (EPA Worker Protection Standard) and state pesticide use reporting laws [1]. California's Department of Pesticide Regulation, for one, requires growers to report pesticide use by site within specified timeframes [11]. Those legal requirements are a floor, not a ceiling.
For efficacy comparison, you need these fields beyond the legal minimum:
- Growth stage at application (BBCH scale, or at minimum a descriptive: pre-bloom, full bloom, fruit set, pea-size, veraison).
- Actual gallons per acre delivered (from calibration, not the target rate).
- Wind speed and direction at application start and end.
- Canopy wetness at application (dry canopy vs. residual moisture from dew or rain).
- Hours since last rain event.
- Spray operator and equipment ID.
None of this is onerous when it's built into your logging system. It becomes painful only when you try to reconstruct it after the season from memory or from a notebook that got soaked in August.
At disease rating time, record: date, growth stage, rater's identity, sample size (clusters or leaves per block), rating scale used, and the raw data by rating unit, more than the mean alone. Keeping the raw data lets you calculate variability within the block, which tells you whether your mean is trustworthy.
Review your block comparisons twice, more than once. A mid-season review at veraison lets you adjust programs before harvest pressure lands. An end-of-season review feeds next year's program planning, and you'll do it with a clearer head than during crush.
Frequently asked questions
How many blocks do I need to compare for results to mean anything?
There's no magic number, but two blocks is the minimum and it only works if the blocks genuinely match on variety, age, and canopy. More blocks with similar profiles give you more confidence. University extension researchers typically use at least four replicate plots per treatment. In a commercial setting, two to three similar blocks per program is workable for decisions, but treat the results as directional rather than definitive.
Can I use yield data as a proxy for fungicide efficacy?
Generally no, and extension advisors at UC Davis and Cornell both caution against it. Too many non-disease factors drive yield: crop load decisions, irrigation, canopy management, berry set weather. Yield can supplement your disease incidence and severity data, but it can't replace it. If severity is high and yield still looks okay, you may just have a vigorous vine compensating rather than an effective spray program.
What's the difference between efficacy and residual efficacy, and does it matter for block comparisons?
Efficacy is how well a material controls disease. Residual efficacy is how long it keeps working after application. Comparing blocks with different spray intervals mixes both signals. A block sprayed every seven days with a good material may beat a block sprayed every 14 days with the same material. If you don't record spray interval per block, you can't separate product performance from timing. Compare programs at the same interval, or account for interval differences explicitly.
How do I know if I'm seeing fungicide resistance rather than a product that just doesn't work well?
The clearest signal is a program that worked well for several seasons, then declined without any obvious change in timing, rate, or weather. FRAC code history matters: if you've run the same single-site FRAC group (3, 7, 11, or 13) for three or more consecutive seasons without rotation, resistance is likely. Contact your UC Cooperative Extension, Cornell, or WSU farm advisor; some universities offer sensitivity testing on field isolates to confirm resistance.
Does the EPA Worker Protection Standard require me to keep the kind of detailed records needed for efficacy comparisons?
No. 40 CFR Part 170 requires spray records sufficient for worker safety and re-entry interval compliance, not for agronomic analysis. You need pesticide name, rate, date, location, and applicator. Growth stage, equipment calibration, and canopy notes are voluntary. But those voluntary fields are exactly what separates a comparison you can act on from one you have to throw out.
How do I compare efficacy when blocks have different disease pressure because of different microclimates?
Use a weather-based disease model to index pressure for each block separately if you have block-level weather data, or use the nearest regional station as a common baseline. UC IPM's models for California and NEWA for the eastern U.S. provide infection period counts by date and location. A block with high regional pressure and low incidence carries a stronger program signal than a block with low pressure and low incidence.
Should I rate disease incidence on leaves or clusters, or both?
For powdery mildew, rating both gives you more information. Leaf ratings early in the season (shoot emergence through bloom) capture early inoculum buildup. Cluster ratings at veraison measure the outcome that matters for wine quality. For Botrytis, cluster ratings at harvest are most relevant. UC IPM recommends at least 10 clusters per block at veraison for a reliable incidence estimate; Cornell suggests 20 for better precision.
Can I compare spray programs across different grape varieties in the same vineyard?
With care. Varieties differ a lot in disease susceptibility: Chardonnay and Pinot Noir are highly susceptible to powdery mildew, Cabernet Sauvignon less so, and many hybrid varieties carry partial resistance. Compare programs across varieties and you'll almost certainly see variety effects that swamp program effects. Stick to same-variety comparisons where you can. If you must cross varieties, use the university efficacy tables to interpret the baseline susceptibility difference.
How long should I run a block comparison before acting on the data?
Two full seasons minimum for foliar diseases like powdery mildew and Botrytis, because year-to-year weather variation can produce a 10-15 percentage point swing in incidence on its own. One exceptional year tells you little. For trunk diseases like Eutypa dieback, three to five seasons is more realistic given how slowly symptoms develop. A very large difference in year one (more than 25 percentage points in incidence) is worth investigating right away rather than waiting.
What's the best way to organize spray records so block comparisons are fast at the end of the season?
Structure records by block from the start, not by date or product. Each spray event should tie to a specific block, growth stage, calibration result, and weather note at application. Digital systems that link spray events to block profiles and export by block make end-of-season comparison far faster than paper logs or date-organized spreadsheets. Review record completeness monthly during the season rather than reconstructing missing data in October.
How do I present efficacy comparison data to a consultant or extension advisor?
Bring the raw data, more than your summary. An advisor needs the covariate table (variety, age, trellis, spray interval, FRAC rotation history), the rating protocol, and the actual rating scores per sample unit, more than the means. Lead with what you controlled for and what you didn't. A good advisor will tell you which differences are worth acting on and which sit inside normal variation. The raw data also lets them spot sampling issues you missed.
Are there any published benchmarks for acceptable disease incidence levels in commercial wine grapes?
Not universal ones. UC IPM Grape Pest Management guidelines suggest powdery mildew incidence above 5-10% on clusters at veraison is likely to affect wine quality, especially for white varieties. Botrytis thresholds are context-dependent: producers of dry table wines generally want near-zero bunch rot at harvest, while botrytized styles have a different target entirely. WSU and Cornell extension materials give similar qualitative benchmarks, but commercial tolerance ultimately depends on your buyer and wine style.
Sources
- U.S. EPA, Worker Protection Standard for Agricultural Pesticides, 40 CFR Part 170: EPA Worker Protection Standard requires spray records including pesticide name, rate, date, location, and applicator; record-keeping requirements are a compliance floor, not an agronomic tool.
- UC Cooperative Extension, UC Agriculture and Natural Resources Viticulture and Enology: UC Cooperative Extension acknowledges that results from research trials may not directly translate to commercial production settings.
- Washington State University Extension, Wine Grape Pest Management: WSU Extension flags spray timing relative to growth stage as the single biggest source of trial-to-trial variation in fungicide efficacy work; WSU publishes fungicide efficacy tables for Pacific Northwest wine grapes.
- UC IPM Online, Pest Management Guidelines: Grape (Powdery Mildew): UC IPM recommends rating at least 10 clusters per block at veraison using a 0-5 severity scale per cluster for powdery mildew assessment; fungicide efficacy tables rank materials from excellent to poor.
- Cornell Cooperative Extension, New York and Pennsylvania Pest Management Guidelines for Grapes: Cornell's viticulture program uses leaf rating at shoot emergence and bloom plus cluster rating; Cornell IPM provides worked examples of paired comparison approaches for on-farm trials.
- UC IPM Online, Pest Management Guidelines: Grape: UC IPM includes weather-based disease models for powdery mildew tied to a statewide weather station network, providing regional disease pressure indices.
- Network for Environment and Weather Applications (NEWA), Cornell University: NEWA provides vineyard-specific weather-based disease models for powdery mildew, Botrytis, and downy mildew using the closest weather station for growers in the eastern U.S.
- Fungicide Resistance Action Committee (FRAC), Mode of Action Classification: FRAC assigns mode-of-action codes to every registered fungicide; single-site fungicides (FRAC groups 3, 7, 11, 13) carry higher resistance risk than multi-site materials.
- UC Davis Department of Plant Pathology, Powdery Mildew Fungicide Resistance Research: QoI fungicides (FRAC 11, strobilurins) have documented resistance in Erysiphe necator in several California wine regions, confirmed in UC Davis plant pathology research published in the early 2010s.
- UC Cooperative Extension, Botrytis Resistance in California Vineyards: Fenhexamid (FRAC 17) resistance in Botrytis cinerea is documented in California and Pacific Northwest wine grapes.
- California Department of Pesticide Regulation, Pesticide Use Reporting: California DPR requires growers to report pesticide use by site within specified timeframes under state pesticide use reporting laws.
Last updated 2026-07-09