How to document a bloom count and berry set assessment for yield forecasting
TL;DR
- Yield forecasting starts at full bloom: count shoots and flower clusters on 10 or more sample vines, then return at berry set (about 40 to 60 days later) to measure how many flowers became berries.
- Multiply retention rate by flowers per cluster and average cluster weight from past harvests.
- UC and WSU protocols show set rates of 20 to 60 percent by variety.
Why does bloom-to-berry-set documentation matter for yield forecasting?
A yield number that arrives at harvest is a receipt, not a forecast. It tells you what happened after you could have done anything about it. Irrigation adjustments, crop thinning, booking extra picking crews, lining up tank space: all of it needs weeks or months of lead time. The bloom count gives you your first real number, which is how many flowers this block actually carries. The berry set assessment, done four to six weeks later, tells you what fraction of those flowers turned into berries. Multiply the two together with a cluster weight factor and you have a defensible pre-veraison yield estimate [1].
This matters most for small wineries and custom-crush clients with contractual tonnage on the line. Coming in 30 percent under expectation without warning is a relationship problem. Coming in 30 percent under and telling your winery client in early July gives everyone options.
Nobody has clean data on exactly how much accuracy a rigorous protocol buys you over a back-of-the-envelope guess. The closest published guidance, from UC Cooperative Extension viticulture programs, is that shoot and cluster counts at bloom, paired with a berry-set check, can land a yield estimate within 10 to 15 percent of actual harvest weight in years without major post-set disruption [1]. That range is good enough to make real decisions.
When should you do the bloom count in the vineyard?
Do the count at full bloom, meaning 50 percent or more of the caps (calyptras) have shed. That is Eichhorn-Lorenz Stage 23, the phenological reference most extension programs use [2]. On the ground it looks like this: you walk the rows, you see the tiny flowers open with caps on the leaves or the ground, and clusters are fully elongated but berries haven't set yet.
Timing swings hard by region and variety. Napa Chardonnay often hits full bloom in late May to early June. Finger Lakes Riesling may wait until mid-June. Willamette Valley Pinot Noir usually runs mid-June [3]. The window is narrow, often three to seven days per block, and weather closes it fast. A heat spike can push bloom to completion in 48 hours.
Check your blocks daily once you see 20 to 30 percent cap shed starting.
Count within two days of full bloom. Earlier, and some clusters aren't fully open, so you undercount. Later, the caps are gone and early berry set blurs the flower count.
How many vines do you need to sample for a reliable bloom count?
The minimum defensible sample for a block under 10 acres is 10 vines, with every shoot counted on each one. For blocks over 20 acres, or blocks with real internal variability (different rootstocks, soil types, or irrigation zones), go to 20 vines [1][4].
How you pick the vines matters as much as how many. Don't grab the easy vines near the headland or the row ends, because they behave differently from the block interior. Divide the block into a grid and select vines at fixed intervals. Every fifth row, every tenth vine in the row, is a common field protocol. Mark each one with flagging tape or a stake so you return to the exact same vines at berry set.
Record vine location by GPS or by row and vine number. This sounds obvious. It's also the step most growers skip, and then they can't find their sample vines a month later when berry set rolls around. A hand-drawn field map works. So does a notes app. Memory does not.
For each sample vine, count every shoot and every cluster. Don't estimate. Count. Record clusters per shoot as your primary metric rather than total clusters, because shoot count varies vine to vine, and that ratio is what normalizes your estimate across the block [1].
What exactly do you count during a bloom assessment?
At bloom you record three things per sample vine: total shoots, total flower clusters (inflorescences), and average flowers per cluster from a subsample.
You don't count every flower on every cluster. That's a waste of a day. Count all flowers on three to five representative clusters per vine, choosing one near the base, one mid-canopy, and one at the tips to account for position variability. Average those counts. That's your flowers-per-cluster figure [4].
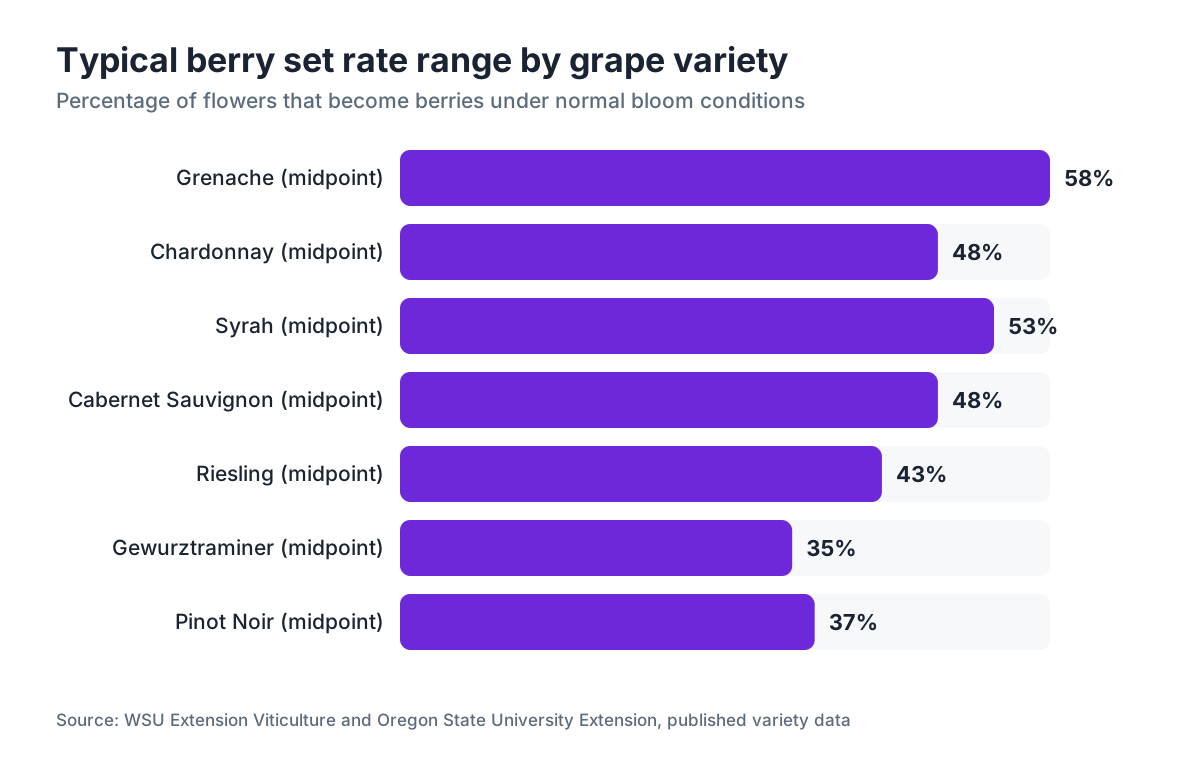
Flower count per cluster matters because berry retention is expressed as a percentage of flowers, and varieties differ enormously. Grenache and Chardonnay often set 40 to 60 percent of their flowers. Pinot Noir and Merlot frequently set only 20 to 40 percent under normal conditions, and Pinot is notoriously sensitive to rain and cold at bloom, which can crash set below 10 percent in a bad year [5].
Record it all the same way every year. A table with columns for vine ID, shoot count, cluster count, clusters-per-shoot ratio, and flowers-per-cluster count is enough. Consistency beats elegance here, because the whole point is comparing this year to last year and the year before that.
| Field | What to record | Notes |
|---|---|---|
| Vine ID | Row and vine number or GPS | Mark with flagging tape |
| Shoot count | All shoots on the vine | Include secondary shoots |
| Cluster count | All inflorescences | Count even small ones |
| Clusters per shoot | Cluster count / shoot count | Your primary forecasting ratio |
| Flowers per cluster | Average of 3-5 counted clusters | Subsample only |
| Date | Calendar date | Needed for phenological records |
| Observer | Initials | Supports compliance and QA |
How do you conduct the berry set assessment four to six weeks later?
Return to the exact same vines you flagged at bloom. That is why the flagging tape matters. At berry set (E-L Stage 27, roughly when berries reach 5mm diameter), you measure what fraction of those flowers actually became berries [2].
For each cluster you counted flowers on, count the berries now. Divide berries by the original flower count for that cluster. That's your berry retention rate as a percentage. Average it across all counted clusters in the block.
Record coulure and millerandage at this stage too. Coulure is the shatter of berries before or just after set, leaving loose, bare rachis sections. Millerandage is uneven berry size, with small seedless shot berries mixed among normal ones. Both cut your effective yield and your fruit uniformity at harvest, so both go in the record as qualitative notes (none, mild, moderate, severe) alongside the berry count [5].
If you photographed your sample clusters at bloom, shoot them again at set with the same framing. Side-by-side photos beat notes for quick visual calibration year over year, and they take about 30 seconds per cluster.
Record the set percentage the same way you recorded bloom data: consistent table, with date, vine ID, and observer. The set percentage and the bloom flowers-per-cluster number together give you estimated berries per cluster heading into summer.
How do you convert bloom and set data into an actual yield estimate?
The math has four steps.
First, estimated berries per cluster: multiply flowers per cluster by berry retention rate. Count 180 flowers per cluster with 38 percent set and you get 68 berries per cluster.
Second, estimate cluster weight at harvest. If you don't have historical cluster weights from this block, use variety-specific reference ranges to start. WSU extension data puts average cluster weights at 80 to 200 grams for most Vitis vinifera varieties, with Cabernet Sauvignon around 100 to 120 grams, Chardonnay around 120 to 150 grams, and Riesling around 80 to 100 grams at typical commercial harvest [6]. Your own block's harvest history beats any published average.
Third, scale to the block: multiply clusters per vine by estimated cluster weight, then by the vine count in the block. Convert grams to pounds or tons as needed (1 short ton = 907,185 grams; 1 pound = 453.6 grams).
Fourth, apply a loss factor. Post-set losses from disease, bird damage, sunburn, and late-season shatter routinely run 5 to 15 percent. Your historical records tell you what's typical for your site. Build it in as a downward adjustment.
Re-run the whole thing at veraison with actual cluster counts and average berry weights from a sample. That second estimate, done four to six weeks before harvest, typically lands within 5 to 10 percent of final weight in a normal year [1].
What records do you actually need to keep, and in what format?
Bloom and berry set assessments aren't pesticide records, so no law imposes a required format on them. But they back up the ranch record that makes your spray timing defensible, and agencies in California, Washington, and New York increasingly expect growers to show a decision rationale when they apply fungicides during bloom for Botrytis control [7][8].
Practically, keep the record in whatever medium you'll actually use. A field notebook transferred to a spreadsheet within 24 hours is fine. A phone form that syncs to a shared drive is fine. A napkin that disappears is not. The non-negotiables are date, block ID, vine IDs sampled, observer name, raw counts (not only the averages), and a calculated summary.
Keep the records at least three years to build the historical cluster weight and retention rate averages that sharpen future forecasts. Five years is better. A record that goes back to 2019 is worth more than a perfect count from last week, because it lets you say with confidence what your block does in a cool wet spring versus a hot dry one.
If you already keep spray records digitally, put the bloom and berry set data in the same system so your pesticide timing decisions and your phenology observations live together. Tools like VitiScribe are built around that pairing: the compliance record and the field observation in one place. That matters when you're trying to reconstruct why you made a Botrytis spray call at early bloom instead of waiting until post-set.
For growers with employees doing the counts, EPA Worker Protection Standard (WPS) training records should be current before bloom scouting begins, because workers entering treated areas within the Restricted Entry Interval must have documented WPS training [9].
How do different grape varieties affect your berry set expectations?
Variety is probably the single biggest source of natural variation in berry retention rate. Apply the same retention expectation to every block on the property and your forecasts will drift.
Pinot Noir is the difficult one. Its loose, cylinder-to-shouldered clusters and small berries come partly from setting a relatively low percentage of flowers even in the best conditions, and it reacts sharply to weather at bloom. Research from Oregon State University's viticulture program shows Pinot Noir set rates in western Oregon running from about 18 to 55 percent depending on bloom conditions, with cold wet springs pulling retention toward the low end [5].
Chardonnay and Cabernet Sauvignon are steadier. WSU extension data puts Cabernet Sauvignon set at 35 to 60 percent under normal conditions [6]. Grenache, Syrah, and several Italian varieties (Sangiovese, Nebbiolo) can reach 50 to 70 percent set in warm bloom weather.
Muscat varieties and some Gewurztraminer clones are prone to natural millerandage, where a real fraction of set berries stay tiny and seedless. That drops effective yield and skews berry weight estimates. A high berry count in these varieties doesn't translate linearly to weight the way it does in Cabernet.
Keep variety-specific retention rates as a separate column in your historical records. After three or four years you'll have your own site-calibrated numbers, which beat any published table.
| Variety | Typical set rate range | Notes |
|---|---|---|
| Pinot Noir | 18-55% | Very weather-sensitive at bloom |
| Chardonnay | 35-60% | More consistent; millerandage possible in some clones |
| Cabernet Sauvignon | 35-60% | Reliable setter in warm climates |
| Grenache | 45-70% | High natural set; thinning often needed |
| Syrah | 40-65% | Moderately consistent |
| Gewurztraminer | Variable, 20-50% | Prone to millerandage; berry weights vary |
| Riesling | 30-55% | Sensitive to coulure in wet springs |
What can go wrong with bloom counts and how do you catch errors?
The most common problem is observer inconsistency. Put two people on the same vine and they'll often get different numbers, especially on flowers per cluster, because cluster density changes by position and the outer flowers are easier to see. Fix it by assigning the same observer to the same vines from bloom through berry set, or by having observers count together on a calibration vine at the start of each session.
The second problem is missing the window. Count too early, before full bloom, and you undercount open flowers, so the retention math runs off. Count too late, especially in a fast-setting variety like Pinot Noir, and some berries are already visible, which mixes phenological stages in a single count. Start a daily check on your bloom-sensitive blocks at E-L 19 (pre-bloom) so you can schedule the count precisely.
Sampling bias toward accessible vines is real. Headland rows, end vines, and vines near roads carry different shoot vigor and fruiting from interior vines, because they get more light, more air movement, and sometimes more spray coverage. Your sampling grid should flat-out exclude the first and last two rows and the first and last five vines in each row.
Losing track of your sample vines between bloom and berry set breaks the whole method. A GPS waypoint takes 10 seconds per vine. Flag tape is free. There's no excuse for not finding your sample vines six weeks later.
How do extension programs like UC Davis, Cornell, and WSU approach yield forecasting?
The three major extension programs use the same structure and calibrate it to their own varieties and climates.
UC Cooperative Extension, drawing on UC Davis research, uses the shoot and cluster count method at bloom with a correction at berry set, then re-estimates at veraison using actual cluster and berry weights from a sample [1][4]. Their publications warn that using prior-year data without a current-season bloom check produces systematic errors in variable years.
Cornell Cooperative Extension's viticulture program covers the Finger Lakes, Hudson Valley, and Long Island. It has published protocols for cool-climate varieties and pays particular attention to millerandage and coulure in Riesling, Gewurztraminer, and hybrids like Marquette and Frontenac under northeastern conditions [3]. Cornell's sampling guidance matches the 10-vine minimum for small blocks.
WSU Extension Viticulture covers Washington and the broader Pacific Northwest. It publishes cluster weight tables for regional varieties and has studied the link between canopy light exposure and set, showing that dense, shaded canopy interiors can cut set rates by 10 to 20 percentage points compared to open, well-managed canopies in the same block under the same weather [6].
All three agree on one thing: the number from truck weights at harvest is the only perfect one, and every earlier estimate is an approximation. The goal isn't perfection. It's shrinking the range of your surprise.
How does bloom and berry set documentation support pesticide application records?
Spray timing during bloom is one of the most consequential calls a grower makes for Botrytis, powdery mildew, and bunch rot. A fungicide at early bloom versus full bloom versus post-set can be the difference between real cluster protection and wasted product, and agencies in California, Washington, Oregon, and New York require pesticide applications to be recorded in enough detail to show label requirements were followed [7][8].
Bloom phenology records, specifically the E-L stage and the date you recorded it, become the documented basis for a spray timing decision. If a county agricultural commissioner or a third-party auditor asks why you sprayed a Botrytis fungicide on June 10th, your answer is stronger with a written note that reads "full bloom observed June 9th, E-L 23" than with a memory.
California's Department of Pesticide Regulation requires pesticide application records to include the date, location, pest to be controlled, product name, EPA registration number, rate, and total amount applied [7]. Nothing on that list demands a bloom stage. But tying your phenology record to your spray record builds a coherent decision trail that holds up in any audit.
For growers under third-party certification (Certified Sustainable Winegrowing, LIVE, LODI Rules, or SIP Certified), documentation of decision criteria for bloom sprays is often required outright. Bloom and berry set records satisfy that requirement directly [10].
What tools and templates make this documentation easier in the field?
You don't need anything fancy. A laminated field card with pre-printed columns for vine ID, shoot count, cluster count, and flower count, carried in a chest pocket with a grease pencil, works in wet weather and never needs a battery. After the day's sampling, move the data to a spreadsheet before you forget which block is which.
If you prefer digital, a tablet or phone form in Google Sheets, Airtable, or a dedicated field app with offline sync is the practical upgrade. The offline sync part is the point. Most vineyard interiors have poor cellular coverage, and a form that needs a signal to save is a liability during a three-day window.
For growers running multiple blocks or properties, a central record system that ties phenology observations to block-level spray records is worth the setup time. VitiScribe is built for exactly this, with field observation and compliance records in one place, so your bloom documentation and your fungicide timing live together in a format auditors and certification bodies can read directly.
Whatever the tool, the template needs space for at least these fields: property/block name, date, E-L stage, observer initials, vine IDs sampled, per-vine shoot count, per-vine cluster count, clusters-per-shoot average, flowers-per-cluster average from the subsample, qualitative coulure/millerandage notes, and weather (temperature and any rain in the prior 72 hours). That last field is more useful than it sounds when you're trying to explain a bad set year three seasons later.
Frequently asked questions
How many vines should I sample per block for a bloom count?
Sample at least 10 vines for blocks under 10 acres. For larger blocks or blocks with variable soils and rootstocks, use 20 vines. Always select vines on a systematic grid, avoiding row ends and headlands. Mark them with flagging tape so you return to the same vines at berry set. UC Cooperative Extension recommends this minimum for statistically reliable cluster counts [1].
What phenological stage should I target for a bloom count?
Target E-L Stage 23, defined as 50 percent or more of flowers with caps shed (full bloom). This is typically a three-to-seven day window. Counting before E-L 23 risks undercounting open flowers; counting after risks confusing early berry set with late-stage flowers. Check susceptible blocks daily once you see 20 to 30 percent cap shed.
What is a normal berry set percentage for Cabernet Sauvignon?
WSU extension data places Cabernet Sauvignon berry retention at roughly 35 to 60 percent of flowers under normal bloom conditions [6]. A cool, wet bloom week can push it lower. Hot, dry conditions at anthesis tend to produce more consistent set. Your own block's multi-year average is more useful than any published range.
How do I estimate cluster weight before harvest?
Use your historical harvest weight divided by cluster count for each block. If you don't have that data yet, published extension tables are a starting point: WSU gives average cluster weights of 80 to 200 grams for most Vitis vinifera varieties depending on variety and training system [6]. Weigh a sample of 30 to 50 clusters at veraison to refine the estimate for the current year.
How accurate is a yield estimate made at bloom?
UC Cooperative Extension suggests that bloom-based estimates using shoot counts and a berry set follow-up can come within 10 to 15 percent of final harvest weight in years without major post-set disruption [1]. Accuracy improves significantly with a second estimate at veraison using actual cluster and berry weights. Disease, bird damage, or heat events after set can invalidate any earlier forecast.
What is coulure and how does it affect my yield forecast?
Coulure is the failure of flowers to set, or the early drop of newly set berries, leaving bare sections of rachis. It's common in Grenache, Merlot, and Pinot Noir in poor bloom weather. If you observe moderate to severe coulure during your berry set assessment, reduce your forecast by 15 to 30 percent from what the flower count alone would predict. Record it as a qualitative note alongside your berry count.
Do I need to document bloom counts to satisfy pesticide record requirements?
Not directly. California's Department of Pesticide Regulation requires pesticide application records to include date, location, pest, product, EPA registration number, rate, and amount used [7], but does not require phenological stage records. However, a written bloom stage observation provides documented justification for spray timing decisions, which strengthens your compliance record in any audit.
How does canopy management affect berry set rates?
WSU research shows that dense, shaded canopies can reduce berry set rates by 10 to 20 percentage points compared to open, well-managed canopies in the same block under the same weather [6]. Shoot thinning and leaf removal before bloom improve light penetration and air movement, which supports better pollination and reduces Botrytis risk simultaneously.
When should I do a second yield estimate after the bloom count?
Do a second estimate at veraison, roughly four to six weeks before harvest, using actual cluster counts on your sample vines and berry weights from a sample of 100 to 200 berries per block. This estimate, informed by known cluster weights, typically comes within 5 to 10 percent of final harvest weight in a normal year [1] and gives you enough lead time to adjust logistics.
How do I handle millerandage in my berry count?
Count shot berries separately from normal berries in your subsample clusters, or at minimum note their presence as mild, moderate, or severe. Shot berries weigh significantly less than normal berries, so a high berry count in a millerandage-affected cluster does not translate to proportional weight. Varieties like Gewurztraminer and some Muscat clones are prone to natural millerandage and need a separate weight correction factor.
What is the E-L scale and why do extension programs use it?
The Eichhorn-Lorenz (E-L) scale is a standardized 47-stage system for describing grapevine phenological development from bud burst through leaf fall. Published in 1977, it gives growers and researchers a common language for growth stages that is independent of calendar date or region [2]. Full bloom is E-L Stage 23; berry set is roughly E-L Stage 27. Using E-L notation in your records makes them comparable to extension research data.
Do workers need special training before doing bloom scouting in recently sprayed vineyards?
Yes. Under EPA's Worker Protection Standard, any worker entering a treated area within the Restricted Entry Interval posted on the pesticide label must have WPS safety training documented before entry [9]. Bloom scouting teams should have current WPS training certificates on file. If the REI has expired, standard field worker safety rules apply but the WPS training requirement remains.
How long should I keep bloom count and berry set records?
No regulation mandates a specific retention period for phenological records (as opposed to pesticide records, which California requires for two years minimum). Keep bloom and berry set records for at least five years. Three to five years of data is what it takes to build reliable, site-specific retention rate and cluster weight averages that make future forecasts meaningfully more accurate than a single season's count.
Can I use bloom count data to make crop thinning decisions?
Yes, and this is one of the most direct practical uses. If your bloom count shows clusters per shoot are running 30 percent above your target, you can thin to your desired load at or shortly after berry set, before the vine has invested heavily in berry development. Thinning at set rather than at veraison conserves more vine energy and gives better size uniformity. Your bloom record provides the documented justification for the thinning decision.
Sources
- UC Cooperative Extension, Napa County, Yield Estimation in Winegrapes: Bloom-based estimates using shoot counts and a berry set follow-up can come within 10 to 15 percent of final harvest weight in years without major post-set disruption
- Coombe, B.G., 'Growth Stages of the Grapevine,' Australian Journal of Grape and Wine Research, 1995: E-L Stage 23 defined as 50 percent or more of flowers with caps shed (full bloom); E-L Stage 27 corresponds to berry set at approximately 5mm diameter
- Cornell Cooperative Extension, Viticulture and Enology Program: Finger Lakes Riesling typically reaches bloom in mid-June; cool-climate variety protocols address millerandage and coulure in northeastern conditions
- UC Davis Department of Viticulture and Enology, Grape Yield Forecasting: Recommend sampling at least 10 vines per block with all shoots counted; flowers per cluster counted on a subsample of 3-5 clusters per vine
- Oregon State University Extension, Pinot Noir Viticulture in Oregon: Pinot Noir set rates in western Oregon range from about 18 to 55 percent depending on bloom conditions, with cold wet springs driving retention to the low end
- Washington State University Extension Viticulture, Cluster and Yield Estimation for Washington Vineyards: Average cluster weights for Vitis vinifera range 80 to 200 grams by variety; dense shaded canopies can reduce set rates by 10 to 20 percentage points compared to open canopies; Cabernet Sauvignon set rate 35-60 percent under normal conditions
- California Department of Pesticide Regulation, Pesticide Use Reporting: California pesticide application records must include date, location, pest to be controlled, product name, EPA registration number, rate, and total amount applied
- Washington State Department of Agriculture, Pesticide Management: Washington state requires pesticide application records with label compliance documentation for commercial agricultural applications
- U.S. EPA, Worker Protection Standard for Agricultural Pesticides: Under EPA's Worker Protection Standard, workers entering treated areas within the Restricted Entry Interval must have WPS safety training documented before entry
- California Sustainable Winegrowing Alliance, SIP Certified Standards: Third-party certification programs including SIP Certified require documentation of decision criteria for bloom-period pesticide applications
Last updated 2026-07-11