How to document a weather-based spray decision using disease model output
TL;DR
- A complete spray record for a weather-based decision needs six things: the date and time you pulled the model output, the model name and version, the weather inputs it used, the risk or infection period score it returned, your decision rationale (spray or no-spray), and the product applied.
- Inspectors treat the model output as the reason you sprayed.
- Your record has to capture it.
Why does documenting the disease model output matter for compliance?
The model output is the reason you sprayed, and a spray record that leaves it out looks like a calendar application. Most state spray record rules cover the product name, EPA registration number, rate, target pest, and REI. They say almost nothing about why you applied on that date. That gap is where growers get burned during audits, litigation, and pesticide use report review.
If you sprayed based on a disease model, the model output is your legal and agronomic justification. Leave it out and your spray reads as a calendar application, which carries its own regulatory and liability baggage. An inspector who sees the same product on the same date every 10 days for six weeks is going to have questions. A paper trail showing the Gubler-Thomas index hit threshold on day eight and you sprayed on day nine is a different story.
The EPA Worker Protection Standard (40 CFR Part 170) requires certain records to accompany pesticide applications on agricultural establishments, and some states stack more requirements on top [1]. California's Department of Pesticide Regulation requires pesticide use reports within a defined window, and inspectors can ask for the supporting records. Under a food safety audit (SQF, GlobalG.A.P., USDA GAP), the decision rationale is often scored separately from the application record itself.
A weather-based decision with no weather record is not a documented decision. It's a guess with a product name attached.
What disease models are commonly used in viticulture and what do they output?
Four models cover most of the disease-pressure decisions in U.S. wine grape production, and each one puts out a score or a flag tied to a date. Knowing what each one actually returns is the first step to knowing what to capture.
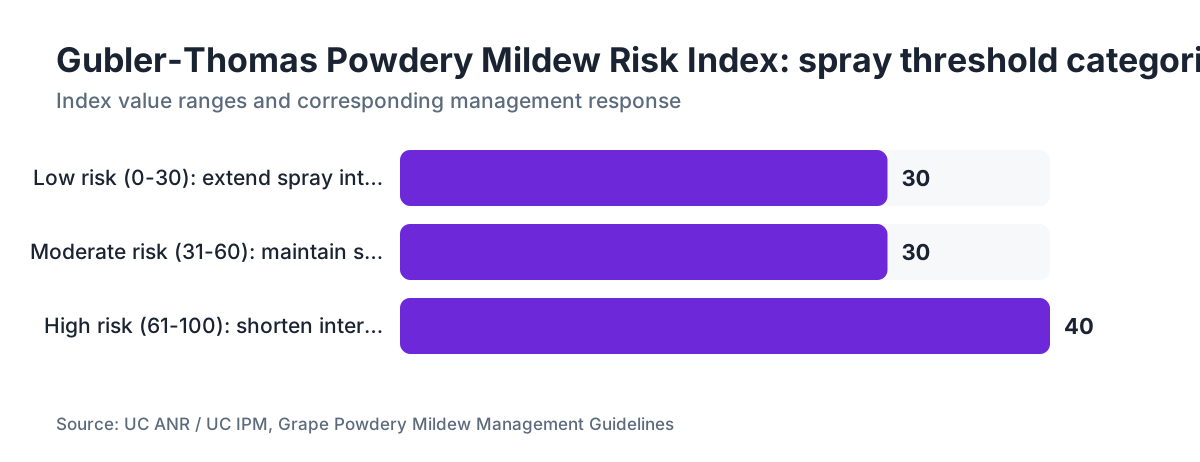
Powdery mildew (Erysiphe necator): UC Davis's Gubler-Thomas powdery mildew risk index is the most widely cited model in California and runs in modified form across the West. It uses a 7-day rolling average of temperatures between 70 and 85 degrees F (21 to 29 C) to produce a risk index from 0 to 100. Below 30 the risk is low, 30 to 60 moderate, above 60 high [2]. Cornell's NEWA platform runs the same model for eastern growers.
Botrytis bunch rot (Botrytis cinerea): The Broome model and its modifications use relative humidity, temperature, and wetness duration to calculate infection periods. NEWA outputs a daily infection risk score and a cumulative season risk.
Downy mildew (Plasmopara viticola): The DMcast model, available through NEWA and regional extensions, uses temperature and leaf wetness. It flags primary infection periods and secondary sporulation windows. WSU's Decision Aid System runs a similar model for the Pacific Northwest [3].
Phomopsis cane and leaf spot: Risk is driven by rainfall during early-season growth stages. Several models combine degree-day accumulation since budbreak with precipitation events.
Every one of these outputs the same thing at its core: a risk score or infection period flag, tied to a specific date and time window, generated from weather station data with a lat/long or station ID. All of it is recordable. All of it should go in your file.
| Model | Disease | Primary input | Output type |
|---|---|---|---|
| Gubler-Thomas | Powdery mildew | 7-day temp average | Risk index 0-100 |
| Broome (Botrytis) | Bunch rot | RH, temp, leaf wetness | Infection period flag |
| DMcast | Downy mildew | Temp, leaf wetness, rainfall | Primary/secondary infection period |
| DAS (WSU) | Multiple | Weather station data | Risk alert by disease |
| NEWA (Cornell) | Multiple | Nearby station data | Daily risk scores |
Every one of these has a printable or exportable output. Download it. Save it.
What weather data inputs does the model actually need, and where do they come from?
A disease model needs the station that fed it, the date range it evaluated, and the weather variables it read, and most records capture none of that. The grower writes 'disease pressure high,' lists the spray, and stops. There's no record of which station supplied the data or what the temperature and leaf wetness readings actually were.
A disease model usually pulls from one of three places: an on-site station you own, a nearby public station from a network like CIMIS in California, AgWeatherNet in Washington, or NEWA across the Northeast and Midwest, or a weather API that blends satellite and ground data [4].
For your record, you need:
- Station name or ID (for example, 'CIMIS Station 52, Napa, CA')
- Date range the model run evaluated
- The key weather variables the model used (temperature, relative humidity, leaf wetness hours, precipitation)
- Any data gaps or estimated values the model flagged
If you're pulling from your own station, note the make, model, and last calibration date at least once per season. This matters the day a record gets challenged. A temperature sensor that drifts 3 degrees F high or low can move a powdery mildew index score by a full risk category.
University extensions consistently say to place on-site stations at vine-canopy height inside the block you're managing, not on a rooftop or over by the parking lot. WSU's viticulture and enology extension publishes guidance on station siting through AgWeatherNet [11].
What exactly should a disease model spray record include?
A complete record has two layers: the standard pesticide application fields your state already requires, and a disease model block that carries your agronomic defense. Here's the field-level version.
Standard application record fields (legally required in most states):
- Date and time of application
- Operator name and license number
- Property/block identification
- Crop and growth stage
- Product name, EPA registration number, formulation
- Application rate (per acre and total)
- Area treated (acres)
- Pest(s) targeted
- REI and PHI per label
Disease model documentation block (your agronomic defense):
- Model name and version (for example, 'UC Gubler-Thomas, accessed via UC IPM website, current as of [date]')
- Weather station used and station ID
- Date range of model evaluation
- Model output: the actual score, flag, or infection period classification
- Threshold you're using as your spray trigger, and where it comes from (your farm's IPM plan, a university recommendation)
- Decision narrative: two or three plain sentences on what the model showed and why you sprayed or held off
- Screenshot or printed export of the model output, filed with the record
That last item, the printout or screenshot, is what separates a documented decision from a reconstructed one. An inspector can read a narrative. They can't verify it. A timestamped model output page is hard to argue with.
Some growers build this into a one-page PDF that pairs the model screenshot with the application fields. Others keep a physical binder with the printout stapled to the application form. Both work. The format matters less than the completeness.
How do you document a no-spray decision based on disease model output?
Documenting a no-spray decision matters more than documenting a spray, and most growers skip it entirely. The record structure is nearly identical: same model, same station, same date range, output below threshold, plus a short narrative.
A no-spray decision on a date when your neighbor sprayed is legally and agronomically meaningful. If your block develops powdery mildew later, you want the record to show the model didn't trigger on that date, not that you forgot. And if your fruit comes in clean and you're pitching reduced-input management to a buyer or a certifier, documented no-spray decisions are your evidence.
The narrative can read: 'Gubler-Thomas index at 22 on [date], below our spray threshold of 30. No application made. Will re-evaluate in 5 days.'
That takes about 90 seconds. File it where you file your spray records. Most state pesticide rules don't technically require no-spray records, but your own IPM plan and any GAP or organic certification almost certainly do.
WSU extension's IPM guidance recommends recording both spray and no-spray decisions when you're using economic thresholds or risk models, because the record shows a decision-making process instead of a calendar routine [3].
How do disease model records help during a pesticide use inspection or audit?
A model record turns a spray that looks calendar-based into a documented decision an inspector can close fast. State departments of agriculture can inspect pesticide records on agricultural establishments. In California, the county agricultural commissioner has authority to review pesticide use reports and supporting documentation [5]. Washington, Oregon, New York, and most other wine grape states hold similar authority.
An inspector looking at a spray record with no rationale has to assume the application was calendar-based. Calendar applications aren't illegal, but they raise questions: was the application necessary under an IPM-mandated program, was a restricted-use product applied without documented justification, do the organic claims hold up.
With a disease model record attached, the inspector sees a framework. The model flagged an infection period. You sprayed within the recommended window. Product and rate match the label. REI and PHI are noted. That file closes.
USDA's Good Agricultural Practices audit program looks specifically at whether you can document the who, what, where, when, and why of each application [6]. The model output is the why. Without it you're answering that question out loud in the moment, which is stressful and unreliable.
Organic operations carry higher stakes. National Organic Program regulations (7 CFR Part 205) require a certified operation's Organic System Plan to address pest and disease management, and require records that support the plan [7]. If your system plan says you use disease models to time applications, your records have to reflect that. A gap between plan and records is a certification risk.
What tools and platforms make it easier to capture and store model output with your spray records?
The best tool is the one that links the model output to the application record and backs both up somewhere off your laptop. Everything else is preference. UC's IPM website (ipm.ucanr.edu) runs the Gubler-Thomas model online, and the output page is printable with a URL you can screenshot [2]. Cornell's NEWA (newa.cornell.edu) does the same for Botrytis, downy mildew, and several other diseases, with daily reports you can download as CSVs [8]. WSU's Decision Aid System has a similar export function [3].
The workflow most managers settle on: run the model every morning during risk season, download or screenshot the output, note the score in your record system, make a go/no-go call. That five-minute routine is the whole thing.
A platform like VitiScribe lets you attach model output screenshots straight to application records, timestamp the decision narrative, and export the full file as a compliance package. That structure earns its keep when you're running multiple blocks with different disease histories. A shared Google Drive folder with clearly named PDFs gets you 90 percent of the way there at zero cost. The tool matters less than the habit.
The workflow to avoid: model outputs living in your email inbox, spray records in a paper binder, nothing connecting the two. That's two separate records with no documented link. Reconstruct that decision later and you're stitching emails to handwritten notes under pressure. Avoidable.
For anyone managing vineyards in high-pressure regions, folding this documentation into daily block-level scouting notes is probably the single highest-value record-keeping habit you can build.
What are the EPA Worker Protection Standard requirements that touch spray decision records?
The Worker Protection Standard doesn't require disease model documentation, but it sets the application record floor your model record sits on top of. The WPS, codified at 40 CFR Part 170, governs pesticide safety on farms, forests, nurseries, and greenhouses [1]. Several of its provisions run right into your spray records.
The WPS requires certain application-specific information to be available to workers and handlers: product name, EPA registration number, active ingredient, location and description of the treated area, and the REI. This has to be posted at a central location or provided on request within a set window after application.
EPA revised the WPS in 2015, with most provisions taking effect in 2017. One addition was a requirement to keep records of handler training and a record of each application for at least two years [1]. The application record has to include the product name, EPA registration number, active ingredient(s), location and description of the treated area, and the date and start/end times.
None of that is the model output. Here's the connection: if your IPM plan is part of your compliance file and it says you use disease models to time applications, then your application record and your model record together form one coherent file. A missing model record opens a gap between what your plan says you do and what your records show you did.
The two-year retention rule for WPS application records is a floor, not a ceiling. California, New York, Washington, and other states require longer. Check your state's number.
How should you handle model uncertainty or data gaps in your documentation?
Document the gap honestly and it's a defensible record. Pretend the data was clean when it wasn't and you've created a different problem. Weather stations fail. Sensors drift. Links drop. You run the model Monday and find the station lost 18 hours of leaf wetness data over the weekend.
A record that says 'NEWA station XYZ showed 12-hour data gap Saturday 0600-1800; leaf wetness interpolated by model. Ran Botrytis model with available data; output flagged moderate infection risk. Applied product X as precautionary measure given growth stage at 50% bloom' holds up fine. It shows you saw the gap, used the best available data, and made a reasonable call.
Nobody has clean published data on how often on-farm stations produce continuous readings across a full season. Extension guidance suggests even well-maintained stations lose 5 to 15 percent of the season to sensor issues, communication failures, or power problems, though that range is a working estimate rather than a measured figure. The closest systematic look is in the NEWA documentation, which describes the data quality checks and gap-filling the platform applies [8].
When the output is genuinely uncertain, say so in your narrative. Name the uncertainty, note any supplementary information you leaned on (regional forecasts, on-site scouting, neighbor reports), and explain your reasoning. That's what a real IPM decision looks like. It isn't always clean.
What does a completed example of a disease model spray record look like?
Here's a realistic record, filled in the way you'd actually do it. It's about 10 minutes of work and would survive most inspections.
Application Record + Disease Model Documentation
Date: June 12, 2025
Operator: J. Martinez (CA License #AG-XXXXX)
Block: Estate North, 8.3 acres, Cabernet Sauvignon
Growth stage: BBCH 57-61 (inflorescence visible, beginning of flowering)
Crop: Wine grapes (Vitis vinifera)
Product applied: Myclobutanil 20EW, EPA Reg. No. 62719-396
Rate: 4 fl oz/acre (labeled rate: 2-6 fl oz/acre for powdery mildew)
Total product used: 33.2 fl oz
Application method: Airblast sprayer
Start time: 6:45 AM, End time: 8:30 AM
REI: 24 hours (per label). Entry restriction posted.
PHI: 14 days (per label).
Disease Model Block:
Model used: UC Gubler-Thomas Powdery Mildew Risk Index
Accessed via: UC IPM website (ipm.ucanr.edu), June 12, 2025, 6:00 AM
Weather station: CIMIS Station 52, Oakville, CA (last calibration check: April 1, 2025)
Evaluation period: June 5-11, 2025 (7-day rolling window)
Model output: Risk index = 64 (HIGH risk category, above threshold of 30)
Season cumulative index: 210
Decision narrative: Gubler-Thomas index reached 64 after 5 consecutive days with temps in the 72-81 degrees F range and no significant nighttime cooling. First spray of the season targeting powdery mildew. Block has a history of early-season infection on shoot tips. Applied myclobutanil at labeled rate per UC IPM powdery mildew program recommendation for high-risk periods. Will re-evaluate in 10-14 days.
Model output screenshot: [filed in 2025 Spray Binder, Tab 3, Page 12]
Notice what's doing the work here. The narrative ties the index number to the weather that produced it, the screenshot reference proves the output existed, and the threshold is stated so nobody has to guess where 64 falls. That's the difference between a record and a note to yourself.
How long do you need to keep spray records and model outputs?
Keep everything, including model outputs, for five years. The federal floor is lower, but five years covers every requirement you're likely to face and costs you almost nothing.
At the federal level, the WPS requires two years for handler application records [1]. FIFRA and its implementing regulations require pesticide applicators to keep certain records, with the exact period depending on pesticide category and applicator license type, generally two to three years.
State requirements often run past the federal minimum. California requires pesticide use reports filed with the county agricultural commissioner within one month of application, with the underlying records retained for two years [5]. Washington requires three years. New York requires two years under Part 325 of 6 NYCRR.
For organic certification, the NOP requires records for at least five years [7]. If you run conventional and organic blocks on the same property, keep everything for five years and skip the confusion.
For food safety certifications (USDA GAP, SQF, GlobalG.A.P.), audit bodies typically want at least one full production season, often two. GlobalG.A.P. requires spray records to be available during the certification audit and retained for a period the certification body defines, typically two to three years.
Five years of PDFs on a hard drive with a cloud backup costs almost nothing. Reconstructing a record you didn't keep costs hours, and sometimes it's impossible. Platforms like VitiScribe that store records with timestamps and export functions make five-year retention easy.
How do university extension programs recommend integrating disease models into spray programs?
UC Davis, Cornell, and WSU are the three main sources of validated viticulture disease guidance in the U.S., and all three treat disease models as standard practice, not an advanced add-on.
UC ANR's powdery mildew guidance recommends using the Gubler-Thomas index to adjust spray intervals and reports that 'growers who calibrate spray programs to the index can reduce fungicide applications without sacrificing disease control' [2]. The record-keeping consequence is direct: if you're claiming index-based management, the index scores have to be in your file.
Cornell's NEWA team recommends logging into NEWA daily during risk periods, downloading the daily report, and using it as the basis for spray decisions [8]. The Cornell Pest Management Guidelines for grapes, updated annually, describe which model outputs correspond to which management actions [12].
WSU's viticulture and enology program recommends the Decision Aid System because it combines multiple disease models with local AgWeatherNet data, giving growers one output that covers powdery mildew, downy mildew, Botrytis, and other pathogens at once [3]. WSU extension materials address record-keeping directly and say spray decisions based on DAS outputs should be documented with the DAS report attached.
The common thread: the model is the decision support tool, and the record is what proves you used it. No extension program I've seen suggests that remembering what the model showed is an adequate substitute for keeping the output.
Frequently asked questions
Do I have to keep the actual model output printout, or is writing the score in my log enough?
Writing the score down beats nothing, but keeping the printout or screenshot is far better. A written score with no source can't be independently verified. A timestamped screenshot from the model platform shows exactly what the system reported on that date, which is much harder to dispute in an inspection, audit, or legal proceeding. PDFs stored in a shared drive take seconds to produce.
What if my on-farm weather station data doesn't match the nearest public station?
Document both. Note that you used your on-site data for the run, record the station ID and calibration date, and note any discrepancy against a nearby public station. If you chose your on-site data over the public station, say why (for example, 'on-site station sits inside the block at vine canopy height; public station is 4 miles away at different elevation'). That's a legitimate agronomic rationale.
Are weather-based spray records required for organic grape certification?
Not as a standalone requirement, but NOP regulations at 7 CFR Part 205 require records that demonstrate compliance with your Organic System Plan. If your OSP says you use disease models to guide pest management, your records have to show you actually do. A spray record without the model documentation opens a gap between your plan and your practice, which is a certification risk at renewal.
Can I document a spray decision after the fact if I forgot to log the model output at the time?
You can reconstruct it, but be honest about what you're doing. Many model platforms let you re-run historical weather data for a past date. If you do that, note in your record that the model was re-run later using historical inputs, and explain why there was no contemporaneous documentation. A reconstructed record flagged as such is far better than a backdated one presented as original.
What disease model should I use for downy mildew if I'm in the Pacific Northwest?
WSU's Decision Aid System, built on AgWeatherNet data, is the primary recommendation for Pacific Northwest growers. It runs the DMcast model for downy mildew alongside powdery mildew and Botrytis models, and it outputs daily risk alerts you can download and file. WSU extension's viticulture team supports the platform and publishes threshold guidance for the regional climate.
How do I document a spray decision when I used a weather forecast rather than observed data?
Note that the decision was based on a forecast model run, specify the forecast source and the date you accessed it, and capture the forecasted conditions the model used. Many platforms let you run forward-looking projections. Flag clearly that the decision used projected weather. After the actual event, add a follow-up note comparing observed data against the forecast.
Do food safety auditors actually look at disease model records during USDA GAP audits?
The USDA GAP audit checklist, managed by USDA's Agricultural Marketing Service, includes a pesticide records section that asks for the justification for pesticide use. Disease model documentation answers that question directly. Auditors vary in how deeply they probe, but filing the model output with the application record means you're ready no matter how rigorous the auditor is.
How often should I be running disease models during the growing season?
During high-risk periods (flowering through veraison for most diseases), daily is the standard recommendation from UC ANR, Cornell NEWA, and WSU extension. Outside critical windows, every two to three days is reasonable. The output is only as useful as how often you check it. A risk spike on Tuesday you don't see until Friday means you've missed the optimal spray window.
What's the minimum record I need to satisfy the EPA Worker Protection Standard for a spray based on disease model output?
The WPS requires the product name, EPA registration number, active ingredient(s), location and description of the treated area, date, and start/end times. It doesn't specifically require disease model documentation. But your model record is the agronomic and legal rationale for the application, and it's required by IPM plans, organic certification, and food safety audits even when the WPS doesn't mandate it.
Can I use a mobile app to document weather-based spray decisions in the field?
Yes, and it's often the most practical option. Apps that let you attach photos or screenshots to an application record are ideal. The key is that the model output file and the application record are linked, timestamped, and backed up off-device. Whatever app you use, confirm it can export records in a standard format (PDF, CSV) you can hand to an auditor who isn't using your app.
What happens if I sprayed without disease model documentation and now I'm facing an inspection?
Be straightforward. Reconstruct what you honestly can: re-run the model for the relevant date using historical weather data, note that the reconstruction was done after the fact, and document your plan for contemporaneous recording going forward. Don't backdate records or present reconstructed data as original. Inspectors are generally more interested in whether you're doing it right now than in penalizing one isolated gap.
How do I handle disease model documentation for blocks with no on-site weather station?
Use the nearest validated public station from CIMIS, AgWeatherNet, or NEWA, and document the station ID, its distance from your block, and any known microclimate differences (elevation, proximity to water, frost pocket status). If you're spraying partly because you know your site runs warmer or wetter than the public station, say so in your narrative. That site-specific knowledge is legitimate reasoning.
Is the Gubler-Thomas powdery mildew index validated for all California grape-growing regions?
The model was developed and validated primarily in the San Joaquin Valley and the Napa/Sonoma coastal regions. It's used across California and the western states, but UC IPM notes the index may need calibration for sites with unusual microclimates. Growers in coastal areas with persistent marine influence, or in high-elevation blocks with cool nights, may find the index underestimates risk. Scouting observations should always supplement the model.
Sources
- EPA, Worker Protection Standard (40 CFR Part 170): WPS requires application records to be retained for at least two years, including product name, EPA registration number, active ingredients, treated area, date, and start/end times.
- UC ANR / UC IPM, Grape Powdery Mildew Management and the Gubler-Thomas Risk Index: Gubler-Thomas index categories: 0-30 low, 30-60 moderate, above 60 high risk; growers calibrating spray programs to the index can reduce fungicide applications without sacrificing disease control.
- CIMIS, California Irrigation Management Information System: CIMIS provides station-specific weather data used as inputs for disease models including powdery mildew and Botrytis risk indices in California vineyards.
- California DPR, Pesticide Use Reporting: California requires pesticide use reports to be filed with the county agricultural commissioner within one month of application; supporting records must be retained for two years.
- USDA AMS, Good Agricultural Practices (GAP) Audit Program: USDA GAP audit checklist requires documentation of the who, what, where, when, and why for each pesticide application, including justification for use.
- USDA NOP, National Organic Program (7 CFR Part 205): NOP requires certified operations to maintain records for at least five years sufficient to demonstrate compliance with the Organic System Plan, including pest management practices.
- Cornell NEWA, Network for Environment and Weather Applications: Cornell's NEWA platform provides daily downloadable disease risk reports for Botrytis, downy mildew, and powdery mildew using nearby weather station data; the platform recommends daily logging during risk periods and describes its data quality checks and gap-filling.
- UC ANR, Grape Pest Management Guidelines: UC ANR pest management guidelines for grapes detail disease model thresholds and recommend recording model outputs as part of spray decision documentation.
- WSU AgWeatherNet: AgWeatherNet provides station-specific weather data for Washington state used as inputs for WSU Decision Aid System disease models, and publishes guidance on station siting.
- Cornell University Extension, Pest Management Guidelines for Grapes: Cornell's annual grape pest management guidelines describe which disease model outputs correspond to which management actions and recommend keeping downloadable NEWA reports as spray decision documentation.
- WSU Viticulture and Enology, Decision Aid System: WSU's Decision Aid System integrates multiple disease models with AgWeatherNet weather data and WSU extension recommends documenting DAS-based spray and no-spray decisions with the DAS report attached.
Last updated 2026-07-10