How to read a soil texture triangle for vineyard irrigation planning
TL;DR
- The USDA soil texture triangle sorts soil into 12 texture classes from percentages of sand, silt, and clay.
- For irrigation, the class tells you field capacity, wilting point, and available water capacity.
- Sandy soils hold roughly 0.6 to 1.0 inches of water per foot.
- Clay loams hold 1.5 to 2.0 inches.
- Reading the triangle takes about five minutes once a lab hands you the numbers.
What is the soil texture triangle and why does it matter for irrigation?
The soil texture triangle is a diagram from the USDA Natural Resources Conservation Service (NRCS) that maps the percentages of sand, silt, and clay in a sample onto 12 named texture classes: sand, loamy sand, sandy loam, loam, silt loam, silt, sandy clay loam, clay loam, silty clay loam, sandy clay, silty clay, and clay [1]. Each class sits inside a bounded region. Find where your three percentages meet and you land in one class.
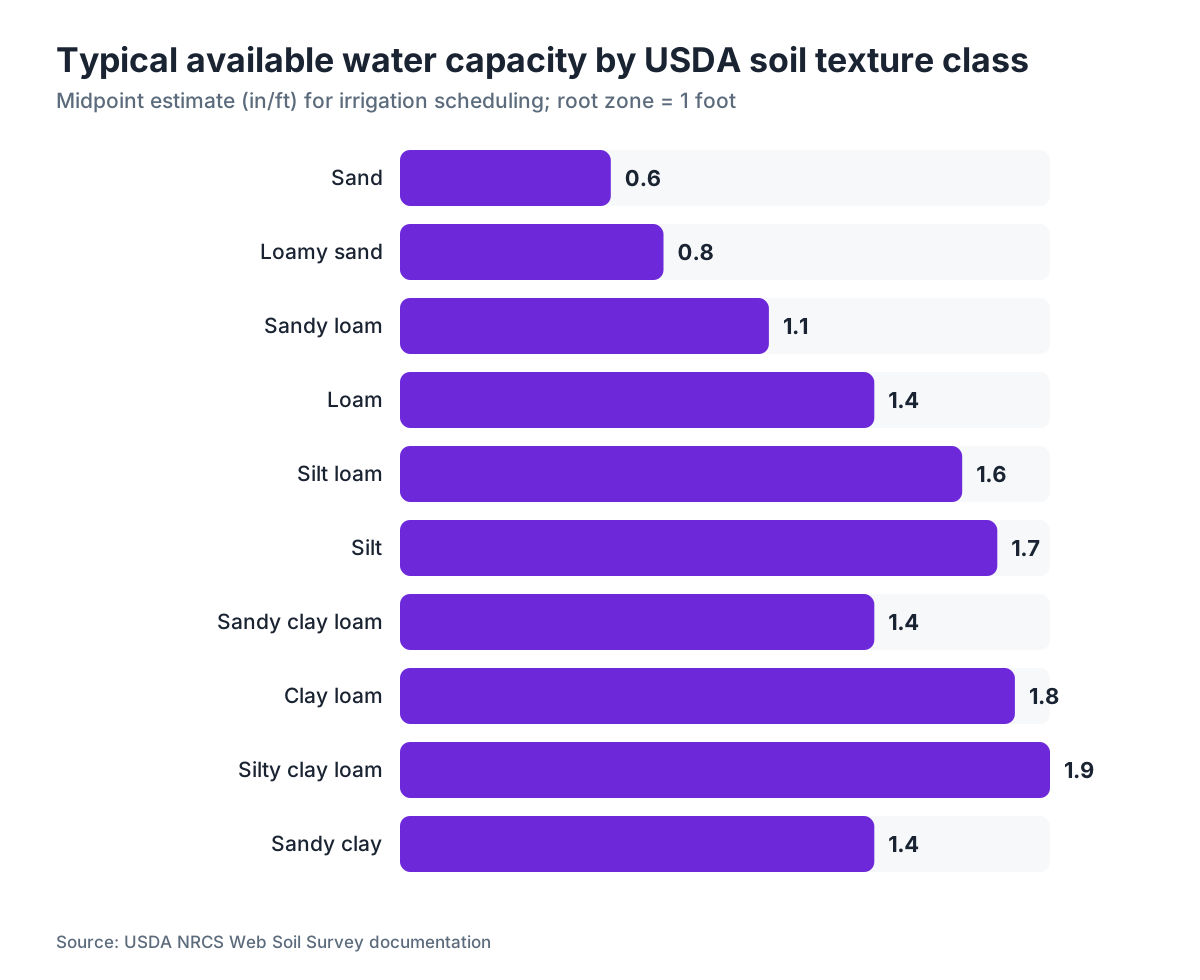
That class is the starting point for almost every scheduling decision you make. Available water capacity (AWC), the water a soil holds between field capacity and permanent wilting point, varies by more than threefold across texture classes. A coarse sandy soil might hold 0.6 inches of plant-available water per foot of depth. A clay loam holds 2.0 inches per foot [2]. Run a drip system on a sandy loam block and schedule it like a clay loam, and you're either starving the vines or drowning them. Your stress data confirms which one too late in the season to fix it.
Texture also sets infiltration rate, which caps how fast you can apply water before you generate runoff or push it past the roots. Sandy soils may take water at 1 to 2 inches per hour. Heavy clays may accept less than 0.1 inches per hour [3]. On a hillside vineyard, getting this wrong stops being an efficiency problem and becomes an erosion problem.
The triangle has limits. It says nothing about structure, organic matter, compaction, or salinity. What it gives you is the most reliable first cut at your irrigation numbers before you spend a dollar on in-ground sensors or a pressure bomb campaign.
How do you actually read the USDA soil texture triangle step by step?
Start with a lab-reported particle size analysis. You need three numbers: percent sand (0.05 to 2.0 mm), percent silt (0.002 to 0.05 mm), and percent clay (less than 0.002 mm). They have to sum to 100. If your lab reports rock fragments or gravel separately, drop them from the calculation and re-normalize the sand, silt, and clay fractions to 100 before you plot anything.
Step 1: Find the clay axis. On the standard USDA triangle, clay percentage runs along the left side, with lines parallel to the base (the sand-silt axis). Each line marks a 10 percent clay increment. Find your clay percentage and trace a horizontal line across the triangle at that level.
Step 2: Find the sand axis. Sand runs along the base, but its lines run diagonally from lower-right to upper-left. Find your sand percentage on the bottom axis and trace that diagonal up and to the left.
Step 3: Find the silt axis. Silt lines run diagonally from lower-left to upper-right. Find your silt percentage on the right side and trace that line. The three lines should converge at one point inside the triangle. If they don't, your percentages don't sum to 100 and you go back to the lab report.
Step 4: Read the named region where the point lands. The NRCS Web Soil Survey and UC Cooperative Extension both publish printable triangles with labeled class boundaries [4]. The USDA also hosts a texture calculator that does this for you once you enter the three values [1].
Step 5: Record the texture class and look up its irrigation parameters. The class anchors the next calculation, available water capacity.
Here's a worked example. Your lab returns 55% sand, 25% silt, 20% clay. Trace the clay line at 20%, the sand diagonal at 55%, and the silt diagonal at 25%. The point falls inside the sandy clay loam region. That class has a typical AWC of 1.2 to 1.5 inches per foot [2]. At a target root zone depth of 2 feet, the soil holds 2.4 to 3.0 inches of plant-available water before vines hit permanent wilting point.
What are the 12 USDA soil texture classes and their irrigation properties?
The table below shows typical available water capacity (AWC) and saturated hydraulic conductivity (Ksat) ranges for each of the 12 USDA texture classes. AWC figures come from NRCS Soil Survey Technical Note 6 and Web Soil Survey documentation [2]. Ksat values come from the USDA NRCS Soil Survey Manual, Chapter 3 [3]. These are central tendencies. Actual values in any block shift with structure, organic matter, and compaction, so treat them as starting points.
| Texture Class | AWC (in/ft) | Ksat (in/hr) | Irrigation Notes |
|---|---|---|---|
| Sand | 0.5 to 0.7 | 6 to 20 | Very short, frequent cycles; deep percolation risk |
| Loamy sand | 0.6 to 0.9 | 2 to 6 | Short cycles; sand-fraction leaching concern |
| Sandy loam | 0.9 to 1.2 | 0.6 to 2 | Good for drip; moderate cycle length |
| Loam | 1.2 to 1.5 | 0.2 to 0.6 | Often the sweet spot for vine balance |
| Silt loam | 1.4 to 1.8 | 0.06 to 0.2 | High AWC; slow infiltration means long rest periods |
| Silt | 1.5 to 1.9 | 0.06 to 0.2 | Rare in vineyards; compaction risk |
| Sandy clay loam | 1.2 to 1.5 | 0.06 to 0.6 | Variable; watch for surface sealing |
| Clay loam | 1.5 to 2.0 | 0.01 to 0.06 | Long intervals; poor wet-season drainage |
| Silty clay loam | 1.6 to 2.1 | 0.01 to 0.06 | High water retention; root anoxia risk |
| Sandy clay | 1.2 to 1.5 | 0.005 to 0.02 | Irrigation stress is fast and severe |
| Silty clay | 1.5 to 1.8 | 0.002 to 0.01 | Near-surface saturation common |
| Clay | 1.5 to 2.0 | <0.002 | Irrigation almost secondary to drainage management |
For most vineyard drip systems, the classes you wrestle with are sandy loam through clay loam. Heavy clays show up in production vineyards (Lodi, parts of Paso Robles, Washington's Horse Heaven Hills), but scheduling there often takes a back seat to managing the perched water table.
One point worth making. If your soil has two distinct layers in the top 3 feet, say a sandy loam A-horizon over a clay B-horizon, the triangle reading for each layer is different. You need a separate sample and calculation for each horizon. Irrigation moves through a layered system, and pretending the profile is uniform gives you real errors in emitter placement and run-time math.
How do you get an accurate soil sample for texture analysis?
The texture reading is only as good as the sample. For irrigation planning, WSU Extension recommends collecting from two depth increments at minimum: 0 to 12 inches (the A horizon or plow layer) and 12 to 36 inches (the main rooting zone for most Vitis vinifera under drip) [5]. If a profile pit shows a distinct layer change, take a third sample at that transition.
Where you sample within the row matters more than most growers think. Under a drip emitter, organic matter and fine particles collect differently than they do in the interrow or at the vine base. For texture analysis, UC Cooperative Extension recommends sampling 18 to 24 inches from the vine trunk, midway between the emitter and the edge of the wetted zone [4]. That spot is the rooting environment you actually manage.
Take cores from 8 to 12 spots within each management zone and composite them. A management zone here is any area with visibly different soil color, slope aspect, vine vigor, or historical yield. Mixing cores from a sandy knoll and a heavy clay swale into one composite wastes your lab money.
Send the composite to a certified soil laboratory. Most state university extension labs and private ag labs run particle size analysis by the hydrometer method (ASTM D422 or USDA Method 3A1a) for $20 to $40 per sample. The lab returns sand, silt, and clay percentages directly. You don't need to ask for USDA texture classification. That's the step you do yourself with the triangle once the numbers land.
How do you convert texture class to actual irrigation run times?
The texture class gives you AWC per foot. From there the math is short. The formula is:
Net irrigation depth (inches) = AWC (in/ft) x Root zone depth (ft) x Management Allowable Depletion (MAD)
MAD for wine grapes is usually 0.4 to 0.5 under standard deficit irrigation protocols. You refill before vines deplete more than 40 to 50 percent of available water. Some research deficit programs push MAD to 0.6 pre-veraison for shoot control, but that's a separate conversation.
Example: Sandy loam, AWC = 1.0 in/ft, root zone = 2 ft, MAD = 0.5. Net irrigation depth = 1.0 x 2 x 0.5 = 1.0 inch per irrigation event.
Now convert to run time. Your emitter delivers water at a known rate (gallons per hour), and you know vine and row spacing. Calculate application rate in inches per hour: (emitter flow rate in gallons per hour) divided by (emitter spacing in feet x row spacing in feet x 231 cubic inches per gallon / 144 square inches per square foot). That gives inches per hour from your system.
Run time = Net irrigation depth / application rate in inches per hour.
The UC Davis irrigation tool for winegrape vineyards (through the UC ANR catalog) walks through this exact calculation and includes texture-based AWC defaults [4]. If a block has multiple texture zones, run the calculation separately for each zone and set emitter zones or valve groups to match.
One honest caveat. AWC from the triangle is a textbook estimate. A pressure plate extraction or a field-calibrated soil moisture sensor gives you the real number for your specific soil. The texture-based calculation is close enough to design the system and open the season. But if you're managing stress tightly for quality, in-season tensiometer or capacitance sensor data beats any desk calculation every time.
What is available water capacity and how does soil texture determine it?
Available water capacity is the gap between field capacity (water content after gravity drainage, roughly a soil matric potential of -0.03 MPa or -1/3 bar) and permanent wilting point (the content at which vines can no longer pull water, roughly -1.5 MPa or -15 bar). The water between those two points is what the vine can actually use.
Clay minerals carry far more surface area per unit volume than sand grains do. That surface area holds water by adhesion. So high-clay soils have both higher field capacity and higher wilting point than sandy soils. The gap between them, AWC, is often widest in loam and silt loam textures. That's why loam is generally called the most productive vineyard texture. It holds enough water to buffer between irrigations but releases it at potentials the vine can reach.
The USDA NRCS Web Soil Survey reports AWC in in/in (inches of water per inch of soil) for mapped soil series across the U.S. [1]. Multiply that value by 12 to get in/ft for vineyard math. A Web Soil Survey AWC of 0.12 in/in for a Yolo loam series, for example, converts to 1.44 in/ft.
Cornell's viticulture program notes that in New York's Finger Lakes and Hudson Valley, glacial parent material creates strong textural variation even within a single hillside block. That makes horizon-by-horizon texture analysis more reliable than leaning on county soil series maps alone [6].
How does soil texture affect drip emitter spacing and placement decisions?
Soil texture controls lateral water movement, and that decides emitter spacing. In coarse sandy soils, water moves almost straight down under a drip emitter with very little sideways spread. In clay soils, the water spreads wide relative to how far it sinks.
In sandy loam, a single 1-gallon-per-hour emitter typically wets a bulb roughly 12 to 18 inches wide and 18 to 24 inches deep. In loam, the same emitter wets 18 to 24 inches wide and 18 to 24 inches deep. In clay loam, you might see 24 to 30 inches of lateral spread [3]. Place emitters at 24-inch intervals on a clay loam expecting the bulbs to connect, and they will. Place the same emitters on a sandy loam and you get dry zones between them.
For most vineyard drip design, WSU Extension recommends a minimum of two emitters per vine on sandy loam or coarser textures, set on both sides of the vine stake [5]. On loam through clay loam, one centered emitter per vine can be enough, though two still buys you redundancy.
Subsurface drip in fine-textured soils (clay loam and heavier) puts emitters 12 to 18 inches deep to deliver water straight to the root zone and dodge surface evaporation. In coarser soils, surface drip is usually fine. Texture is the first question you answer before you sign off on that capital cost.
Can you use Web Soil Survey instead of lab sampling?
Yes, as a first pass, but know what you're getting. The USDA NRCS Web Soil Survey maps soil series at a scale built for farm-level planning [1]. A soil series has a defined texture class and AWC in the database, so you can pull texture, AWC, and Ksat straight out without mailing a sample. That's useful for initial system design, for writing a water use plan for a permit, and for seeing broad vineyard variability.
The catch is resolution. Web Soil Survey polygons can run hundreds of acres and rest on survey-era fieldwork, sometimes from the 1950s or 1960s. Vineyard blocks often vary in texture at a 50 to 200-foot scale that no county survey catches. The Napa Valley floor, for example, has well-documented alluvial fan sequences where texture shifts from sandy loam to clay loam within a 200-foot transect, while survey polygons may show a single map unit across the whole area.
My recommendation: use Web Soil Survey to carve your property into candidate management zones, then pull lab samples inside each zone to confirm or correct the series-level texture. The combination runs about $100 to $200 in lab costs for a small vineyard and gives you a defensible, site-specific baseline. For compliance reporting or plan submissions to a water district, lab-confirmed numbers always read as more credible than survey defaults.
VitiScribe's field records module lets you log texture class, AWC, and horizon data by block and tie them to your irrigation scheduling records. So when an inspector or water district asks for your basis of design, you have it documented and timestamped.
How does soil texture affect pesticide and fertilizer application decisions?
This is where texture crosses into compliance. The EPA Worker Protection Standard (WPS) and state pesticide rules set restricted-entry intervals and buffer zones, and some labels add soil-specific language around leaching potential [7]. Herbicides with high water solubility and low soil binding (certain pre-emergent materials) carry label language cutting rates on sandy or coarse-textured soils, or banning applications within set distances of water. Reading the label for soil texture restrictions is not optional.
For fertigation, texture decides how far a nutrient pulse travels with each irrigation event. On sandy soils, nitrogen applied through the drip line can move below the root zone within a single event. On clay loam, the same application may hold in the top 12 inches for days. That drives your split-application timing and the risk of nitrate leaching into groundwater, a regulated issue in California's Nitrate Control Program areas and in parts of Washington and Oregon [8].
Organic matter works with texture to set cation exchange capacity (CEC), which controls how long potassium, calcium, and magnesium stay available in the root zone. Clay soils have high CEC and buffer nutrients well. Sandy soils have low CEC and flush fast. If you're in a coarse-textured block applying potassium once a year in a single spring broadcast, you're probably losing a real fraction of it to deep percolation before the vines can touch it.
Texture is more than an irrigation parameter. It anchors your whole nutrient and pest management system.
What soil texture is best for wine grapes?
Honest answer: there is no single best texture. Some of the world's most famous wines come off soils most agronomists would call problematic. Champagne's Cote des Blancs is chalk. Mosel Riesling grows in steep slate. California's best Cabernet blocks run from rocky sandy loams in the Rutherford dust zone to heavy clay loams near the bay.
What matters more than texture is how texture works with your water supply, climate, and quality target. Sandy loam in a Mediterranean climate with reliable drip access can make excellent wine because you control vine water status precisely. That same sandy loam in a dry year with no reliable water can collapse vine function by late August.
For practical management, most viticulture consultants work most comfortably in loam through clay loam: enough AWC to buffer between events, enough infiltration to apply water in reasonable run times, and enough structure to hold up good root architecture.
Very coarse textures (loamy sand, sand) demand automation and short, frequent cycles. Very fine textures (silty clay, clay) demand patience, careful wet-season drainage, and the willingness to accept that you're mostly working around the soil's behavior rather than overriding it.
To see texture and site interact in a real production setting, Paso Robles wineries are instructive. The east side of the appellation has deep sandy loam calcareous soils with AWC around 1.0 to 1.2 in/ft, while west-side blocks run clay loam to clay and need a completely different irrigation approach under the same climate envelope.
How do you account for texture variation across a vineyard block?
Most blocks are not texturally uniform. Even a 10-acre block can hold two or three distinct texture zones depending on parent material, slope position, and past cultivation. Ignore that variation and you optimize irrigation for the average, which satisfies nobody.
Electrical conductivity (EC) mapping with a tractor-mounted sensor (Veris or similar) is the fastest way to delineate texture variation before you pull samples. EC tracks clay content well because clay particles hold more ions than sand. A high EC zone is a likely clay-rich zone. Low EC zones tend to be sandier. You can map a 40-acre block in about an hour and generate a prescription for where to pull samples [5].
Once lab samples confirm the zones, the real question is whether the variation is big enough to justify separate irrigation management. If adjacent zones differ by one texture class (sandy loam vs. loam), the AWC difference is maybe 0.3 to 0.4 in/ft. Over a 2-foot root zone at MAD 0.5, that's 0.3 to 0.4 inches difference in net irrigation depth per event. For most drip systems, that's a 10 to 15 minute swing in run time, which may or may not earn a separate valve zone.
If the variation is two classes or more (sandy loam vs. clay loam), the AWC difference can hit 0.8 to 1.0 in/ft over a 2-foot zone. That's a real operational split: different run times, different cycle frequencies, different leaching fraction math. Putting those zones on separate valves is worth the extra manifold cost.
Where the variation is continuous rather than stepped, like a classic alluvial fan gradient from coarse at the apex to fine at the toe, variable rate irrigation is the engineered answer. It's still rare in American vineyards outside large wine company research blocks.
How do you record and use soil texture data in vineyard compliance records?
If you're in a water district with an irrigation water management plan requirement, a nutrient management plan area, or you're chasing organic certification, your soil texture data is a compliance document. It has to be stored, versioned, and retrievable by block.
At minimum, keep the lab report PDF with the particle size analysis, the date and GPS coordinates of each sample location, the depth increment sampled, the derived texture class, and the AWC value you're using for scheduling. Attach these to your block records rather than to a desktop folder that changes laptops every three years.
When an irrigation district auditor or a USDA NRCS conservation planner asks how you arrived at your irrigation schedule, the texture analysis is the primary source document. It's also the basis for any crop water use calculations you file under California's Sustainable Groundwater Management Act (SGMA) reporting [8] or a similar state framework.
Keeping these records organized is exactly the operational paperwork that software built for vineyard field records handles well. VitiScribe's block-level record structure links soil characterization data to irrigation logs, spray records, and harvest notes in one place, which makes pulling a compliance package together far faster than hunting PDFs across five folders.
The USDA NRCS 590 Nutrient Management Standard names soil texture as a required input for calculating nitrogen application rates and leaching risk [9]. If you're working a NRCS cost-share program on a nutrient management plan, your particle size analysis report is a required attachment.
Frequently asked questions
What does the center of the soil texture triangle represent?
The center region of the USDA texture triangle is the loam class, defined roughly as 7 to 27% clay, 28 to 50% silt, and 23 to 52% sand. Loam sits in the center because no single particle size dominates its proportions. For vineyard irrigation, loam is often the easiest texture to manage because it has moderate AWC (1.2 to 1.5 in/ft) and moderate infiltration rates.
Do I need a separate soil texture test for each vineyard block?
Yes, if blocks differ visibly in soil color, slope position, drainage, or vine vigor. A single composite sample works within a uniform management zone, but mixing samples from different zones misleads you. One sample per distinct zone per depth increment is the minimum. For a 20-acre vineyard with two or three distinct areas, that usually means 4 to 8 lab samples at $20 to $40 each, a small cost against a season of mismanaged irrigation.
What is the difference between soil texture and soil structure?
Texture is the proportion of sand, silt, and clay particles. Geology fixes it, and it doesn't change on a human timescale. Structure is how those particles aggregate into clumps, called peds. Good structure improves infiltration and root penetration even in high-clay soils. Tillage, compaction, and organic matter all affect structure. The texture triangle tells you about texture only; you need a field assessment or a lab method like aggregate stability to characterize structure.
Can sandy vineyard soils have good available water capacity?
No. Sandy soils typically hold 0.5 to 0.9 inches of plant-available water per foot, against 1.5 to 2.0 in/ft for clay loams. Organic matter additions help a little by raising water retention, but they can't fully offset coarse texture. Sandy vineyards rely on frequent short irrigations or deep rooting to reach a larger soil volume. That lower AWC also makes vines more sensitive to irrigation system failures during heat events.
How do I use Web Soil Survey to find my vineyard's texture class?
Go to websoilsurvey.nrcs.usda.gov, define your area of interest by drawing your block boundary, then open the Soil Data Explorer tab and select the Physical Soil Properties report. It returns texture class, AWC in in/in, and Ksat by map unit and soil horizon. Multiply AWC in/in by 12 to get in/ft for irrigation math. Confirm the survey result with a lab sample if you're designing a system or writing a compliance plan.
What happens if I ignore soil texture differences across a block?
You optimize for the average and mismanage both ends. Coarse-textured zones get under-irrigated or over-irrigated depending on where you calibrate. Fine-textured zones stay waterlogged through early runoff, or stay dry if you calibrate for sand. In practice this shows up as vine stress variation across the block, yield and quality gaps at harvest, and wasted water. The vineyard reads correctly when texture data drives the schedule.
How does soil texture relate to salinity and leaching fraction in drip irrigation?
Coarse textures have high hydraulic conductivity and flush salts fairly easily. Fine textures accumulate salts because water moves slowly and evaporative concentration runs higher near the emitter. If your irrigation water has elevated EC, texture decides how aggressively you apply a leaching fraction. The NRCS and UC Cooperative Extension both provide leaching fraction calculators that take texture class and irrigation water EC as inputs.
Is hydrometer method or sieve method more accurate for vineyard soil texture?
For clay and silt fractions, the hydrometer method (ASTM D422 or USDA 3A1a) is standard because clay particles are too fine to sieve. Sand fractions can be verified by sieve. Most certified ag labs run the full hydrometer method for particle size analysis. If your lab offers both, specify hydrometer for any sample that might carry significant clay. Texture classes above sandy loam almost always need the hydrometer method.
How deep should I sample for irrigation planning purposes?
Sample at least two depths: 0 to 12 inches and 12 to 36 inches. For deep-rooted vines on rootstocks like 110R or 1103P that can reach water at 3 to 4 feet, a third sample at 24 to 48 inches is worth taking. Each depth can hold a different texture class, and layered profiles (coarse over fine, or fine over coarse) behave very differently from uniform profiles and need separate AWC calculations per horizon.
Does organic matter change the texture class or just the soil behavior?
Organic matter doesn't change the texture class, which rests only on mineral particle size. But it changes behavior within a class a lot. Organic matter raises water-holding capacity, improves aggregate stability, and lifts cation exchange capacity. A loam with 3% organic matter holds more water and drains better than the same loam at 0.8%. The texture triangle stays accurate; it just doesn't capture this modifier.
Can I estimate soil texture by feel instead of a lab test?
Yes, the feel method (USDA field texture procedure) can separate broad classes: sand feels gritty and won't ribbon, clay ribbons more than 1 inch, loam feels intermediate. With practice, experienced soil scientists estimate texture within one class. For scheduling, though, a lab result is more defensible and only costs $20 to $40. The feel method is a quick field check to see if a zone looks different from the lab baseline, not the primary basis for system design.
How do I account for rocky or gravelly soils when reading the texture triangle?
Remove the coarse fraction (greater than 2 mm) before calculating percentages for the triangle. Weigh the less-than-2mm fraction, run the particle size analysis on that fraction only, then correct AWC for rock fragment volume. A soil with 40% rock fragments by volume has roughly 60% of the AWC you'd calculate from the fine-earth texture alone. NRCS Web Soil Survey reports AWC already corrected for rock fragments in its series data.
Sources
- USDA NRCS, Web Soil Survey: The USDA NRCS classifies soils into 12 texture classes based on sand, silt, and clay percentages using the soil texture triangle
- USDA NRCS, Web Soil Survey (Physical Soil Properties report and Soil Data Explorer): Available water capacity by texture class ranges from approximately 0.5 to 0.7 in/ft for sand to 1.5 to 2.0 in/ft for clay loam
- UC Agriculture and Natural Resources, Irrigation of Agricultural Crops (ANR Publication 3382): UC Cooperative Extension recommends sampling 18 to 24 inches from the vine trunk for texture analysis; the UC Davis irrigation tool provides texture-based AWC defaults for vineyard scheduling
- Washington State University Extension, Irrigation Scheduling for Wine Grapes (EM106E): WSU Extension recommends collecting soil samples from two depth increments minimum and at least two emitters per vine on sandy loam or coarser textures
- Cornell University, College of Agriculture and Life Sciences, Viticulture and Enology: In New York's Finger Lakes and Hudson Valley, glacial parent material creates strong textural variation within a single hillside block, requiring horizon-by-horizon texture analysis
- US EPA, Agricultural Worker Protection Standard (40 CFR Part 170): Pesticide labels under the EPA Worker Protection Standard may include soil texture-specific restrictions on application rates and buffer zones due to leaching potential
- California State Water Resources Control Board, Sustainable Groundwater Management Act (SGMA): SGMA reporting in California requires crop water use calculations that reference soil properties including texture for irrigation water management plans
- UC Davis Department of Viticulture and Enology: Texture is the primary soil parameter controlling available water capacity, infiltration rate, and nutrient leaching in vineyard management
Last updated 2026-07-11