Tracking inputs per ton of grapes produced for benchmarking records
TL;DR
- Divide total seasonal inputs (chemicals, water, labor, fertilizer) by tons harvested to get a per-ton cost or use rate.
- Track it every year and you spot waste, defend your spray program, and satisfy organic or GAP auditors.
- Most California vineyards spend $1,500 to $4,000 per acre to farm, so per-ton figures swing hard with yield.
What does 'inputs per ton' actually mean in a vineyard context?
Inputs per ton is one ratio: take any resource you spent during the season, divide it by tons harvested, and you get a use rate that compares cleanly across vintages, blocks, and even the ranch down the road. That single number is the spine of vineyard benchmarking.
Normalization matters because yield swings hard. A frost year can drop a block from 5 tons per acre to 1.5. Track only cost per acre and that frost year looks cheap. Track cost per ton and the truth shows up: you spent nearly the same money to grow far less fruit, so your cost per ton exploded. That distinction drives real decisions on crop insurance, replanting, and what you'll accept per ton from a winery.
The inputs worth tracking fall into a handful of buckets. Chemicals cover pesticides, herbicides, and fungicides. Nutrients cover fertilizer and soil amendments. Water covers irrigation volume. Labor covers hours by task. Equipment covers fuel and custom-hire hours. Every one of those divides down to a per-ton figure.
For compliance, the chemical record carries the most legal weight. EPA's Worker Protection Standard and state pesticide use reporting systems require you to log what was applied, to what acreage, on what date, in what formulation and rate [1]. Tying those application records to a per-ton calculation is the next step, and extension programs at UC Davis and WSU now push growers toward it for benchmarking and audit readiness.
Why track inputs per ton instead of per acre?
Per-acre metrics are fine for planning. Per-ton metrics tell the truth about what you're paying to produce wine grapes.
Here's where per-acre thinking falls apart. Two blocks sit side by side, sprayed on the same schedule, fertilized the same. Block A yields 4 tons per acre. Block B yields 2. On a per-acre basis they look identical. On a per-ton basis, Block B just cost you twice as much to farm. That's a very different situation for a grower paid a flat price per ton.
UC Davis Cost and Return Studies for wine grapes draw exactly this line. Their North Coast Cabernet Sauvignon study reports total cash costs that, divided by expected yield, produce per-ton figures differing by $600 to $1,200 between low-yield and average-yield scenarios in the same region [2]. Extension economists call it the yield-sensitivity problem, and it's the main reason benchmarking programs now lean on per-ton normalization.
There's a compliance angle too. Chase a Salmon-Safe, CCOF organic, or SCS Global certification and auditors will ask how your pesticide load relates to production volume, more than to acreage. Per-ton input intensity connects your spray records to your sustainability story in a way acreage never can.
What inputs should you track for a complete benchmarking record?
A complete input log covers six categories. You don't need all six on day one. Most managers start with chemicals (the records are legally required anyway), then add water and labor.
Chemical inputs. Every pesticide, fungicide, herbicide, and plant growth regulator application. Log the product name, EPA registration number, active ingredient, rate per acre, total acres treated, and date. California's pesticide use reporting system and EPA's WPS already require this [1][3]. The only added step for benchmarking is dividing total pounds of active ingredient (per block or per ranch) by tons harvested.
Fertilizer and soil amendments. Track pounds of actual nitrogen, phosphorus, and potassium per application, plus any sulfur, boron, zinc, or compost tonnage. Divide by harvest tons. This matters more every year in regions with nitrate leaching rules.
Irrigation water. Acre-feet or gallons applied per season, by block if you have sub-metering. Many California water districts already require this reporting [4]. Divided by tons, you get gallons per ton, one of the core water-efficiency metrics in programs like the California Sustainable Winegrowing Alliance.
Labor hours. Break them down by task: pruning, shoot thinning, leaf pulling, cluster thinning, harvest, spraying. Hours per ton by task shows where labor is getting soaked up relative to output.
Fuel and equipment hours. Tractor hours per ton, fuel gallons per ton. Useful for carbon footprint math and for checking custom-hire costs against owning your own iron.
Purchased materials. Trellis wire, bird netting, grow tubes for new blocks. Amortize these over the productive life of the block, then express the annual slice per ton.
Start small. A record that covers chemicals and water beats no record at all, by a mile.
How do you calculate cost per ton and input rate per ton?
The math is easy. Gathering consistent source data is the hard part.
For chemical input rate:
Pounds of active ingredient per ton = (rate per acre × acres treated) / tons harvested from those acres
Say you applied a fungicide at 0.5 lb active ingredient per acre across 8 acres. That block produced 4 tons per acre, so 32 tons total. Your rate is (0.5 × 8) / 32 = 0.125 lb active ingredient per ton.
For cost per ton:
Cost per ton = total seasonal input cost for that category / tons harvested
Say you spent $4,800 on spray materials for a 6-acre Chardonnay block that yielded 18 tons. Cost per ton = $4,800 / 18 = $267 per ton for chemicals alone.
For a whole-ranch roll-up, aggregate all blocks. If blocks have different yields, weight by acreage. Don't just average the per-ton figures, or you'll get a distorted number.
WSU's farm business management team recommends tracking these in a plain spreadsheet that links your application log to your harvest records: one row per application event, one summary tab that auto-calculates per-ton figures at season end [5]. It's cheap, an auditor can read it, and it hands off between staff without a lecture.
Running multiple varieties or blocks under separate contracts? Keep per-ton records by block. A Cabernet block sold at $3,500 per ton carries a very different cost ceiling than a bulk Chardonnay block moving at $400.
What are typical input cost benchmarks per ton for wine grapes?
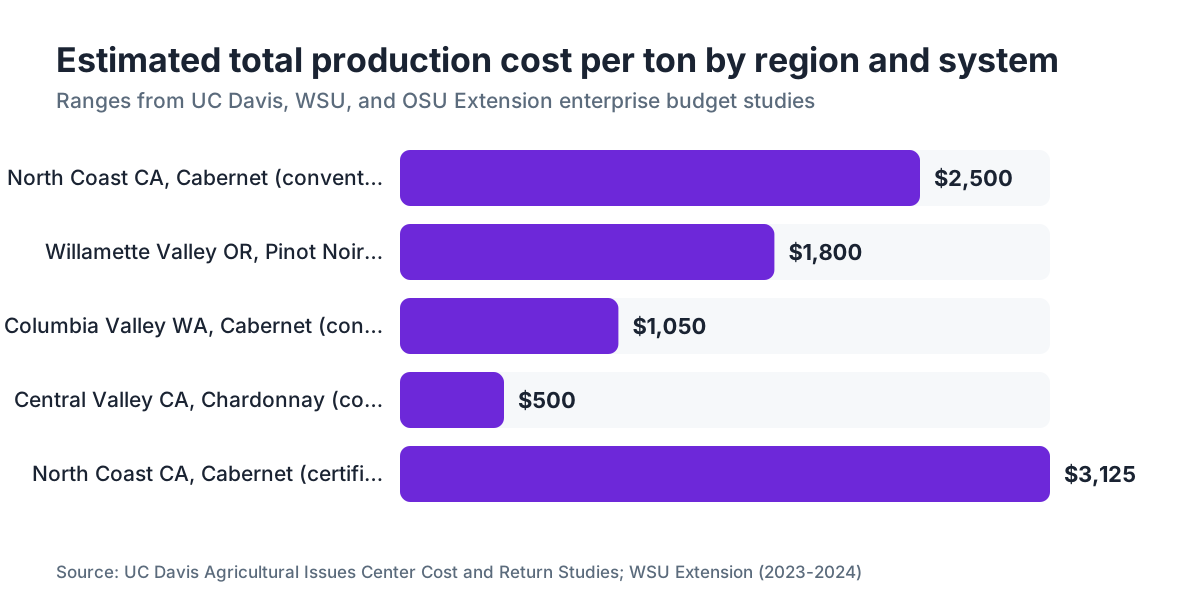
Real benchmark ranges exist. They vary enormously by region, variety, and farming system, so treat them as orientation, not targets.
| Region / System | Total Production Cost Range (per ton) | Source |
|---|---|---|
| North Coast CA, Cabernet Sav., conventional | $1,800 to $3,200 | UC Davis Cost & Return Studies [2] |
| Central Valley CA, Chardonnay, conventional | $350 to $650 | UC Davis Cost & Return Studies [10] |
| Willamette Valley OR, Pinot Noir, conventional | $1,200 to $2,400 | OSU Extension |
| Columbia Valley WA, Cabernet Sav., conventional | $700 to $1,400 | WSU Extension [5] |
| Certified organic premium regions (CA) | Add 15 to 30% over conventional | CCOF / UC Cooperative Extension |
A few notes on these ranges. They include direct costs: chemicals, fertilizer, water, labor, equipment. They usually leave out land cost and overhead unless a study says otherwise. Your numbers will land somewhere in these bands, or outside them if you carry unusual labor costs, heavy frost-protection fuel use, or a disease-prone vintage.
The most useful benchmark isn't the industry average. It's your own three-year average. If your chemical cost per ton was $180 in 2022, $210 in 2023, and $245 in 2024, that trend beats any outside number. It tells you your spray program expanded, your yields dropped, or your chemical prices rose, and now you get to figure out which one.
Cornell's viticulture and enology program builds enterprise budget templates for Finger Lakes varieties with per-ton cost breakdowns. Pull them even if you farm outside New York. The structure transfers [6].
How do spray records connect to per-ton benchmarking for compliance?
In most states a spray record isn't optional. It's the law. The real question is whether your required records also earn their keep as benchmarking data, or just sit there as a compliance checkbox.
EPA's Worker Protection Standard requires employers to keep records of every pesticide application for two years: the product, EPA registration number, active ingredient, concentration, total amount applied, application method, plus location and date [1]. California goes further, requiring growers to file pesticide use reports with the county agricultural commissioner within seven days of each application [3].
Those records, exactly as required, give you everything a per-ton chemical log needs. The only gap is linking application records (filed by date and acreage) to harvest records (usually by block or load ticket). If your blocks and spray zones are the same geographic units, the link is direct. If they're not, build a crosswalk table once.
For GAP audits, which many large winery buyers now demand of growers, auditors check that application records are complete and that there's a traceable chain from block to input to harvest [7]. A per-ton summary isn't required by GAP, but it's exactly the kind of organized secondary record that makes an audit fast and boring, which is what you want.
Organic certification stacks on another layer. CCOF and other USDA-accredited certifiers require you to document every input applied, confirm those inputs sit on the National Organic Program approved materials list, and keep records ready for inspection [11]. Tracking inputs per ton produces a clean secondary record of your organic input intensity, which matters when you're selling certified fruit at a premium.
What's the simplest record-keeping system for tracking inputs per ton?
You can do this with a notebook and a spreadsheet. Most operations should start there before spending a dime on software.
The minimum system has three linked records. One, an application log: date, block, product, rate per acre, acres covered, total product used, cost. Two, a harvest log: block, date, tons delivered, buyer, contract price. Three, a seasonal summary: for each block, pull total cost per category from the application log, divide by tons from the harvest log, write down the result.
That seasonal summary is where the value lives. One page per block, per year. Staple last year's next to this year's. That's your trend analysis, done.
Managing more than 20 acres or several distinct blocks? A spreadsheet with linked tabs earns back its setup time fast. WSU's farm management group publishes free enterprise budget spreadsheets with input-tracking structures built in [5]. UC Cooperative Extension cost studies ship with companion worksheets [2]. Start with those instead of building from scratch.
If you want your spray log, harvest data, and per-ton calculations in one place with automatic roll-ups, tools like VitiScribe are built for vineyard field operations. The payoff is that your application records, the ones you're already keeping for WPS, feed your input-per-ton benchmarking with no second round of data entry.
Whatever system you pick, the non-negotiable is consistency: same units every year, same block boundaries, same cost categories. Change your definitions midway through and you've made data that can't be compared across vintages, which kills the whole point.
How do you use per-ton data to actually improve your operation?
Records only matter if you act on them. Here's how the data drives real decisions.
Start with spray program review. If your fungicide cost per ton climbs year over year without better fruit quality or fewer losses, that's a signal. Prices rose (check your invoices), applications increased (check your log), or yields dropped (check your harvest records). Each explanation points to a different fix. Dropping yields with steady spray costs is the usual culprit, and it often traces back to vine nutrition or canopy management, not the spray program at all.
Next, block-level investment calls. If a block runs chemical costs per ton 40% above your ranch average, and it isn't a quality-premium block, that's a candidate for replanting, a variety change, or a lease renegotiation. You won't see this without per-ton data, because a smaller block can look perfectly fine per acre.
Then contracts. Show a winery buyer your actual cost-per-ton trend for the fruit you deliver and you're negotiating from documented ground, not a hunch. Buyers respect it. Very few growers walk in with actual numbers.
Labor efficiency is fourth. Rising pruning labor per ton could mean crews slowed down, or it could mean your yield targets shifted and the same hours now produce less fruit. Per-ton labor tracking separates those two.
Last, sustainability metrics. Programs like the California Sustainable Winegrowing Alliance self-assessment and Lodi Rules ask growers to track and reduce input intensity over time [9]. Per-ton figures are the natural way to prove you did.
What records do you need to keep for GAP, organic, and sustainability audits?
Requirements vary by program, but per-ton input records satisfy most of them with barely any extra work.
For USDA Good Agricultural Practices audits, auditors use the USDA Harmonized GAP Audit Standard, which covers traceability, worker hygiene, and input records [7]. The pesticide record requirements line up with WPS: product, rate, date, location, applicator. You don't need per-ton calculations for GAP itself, but an organized seasonal summary showing all inputs by block speeds the audit way up.
For CCOF organic certification, USDA National Organic Program regulations (7 CFR Part 205) require you to keep records sufficient to show compliance for five years [8]. The regulation's language: "the producer must maintain records that document the management and sale of organically produced products." That five-year window runs longer than WPS's two-year minimum, so organic operations should set retention to five years for everything and stop tracking two separate clocks.
For California Sustainable Winegrowing Alliance certification, the self-assessment tool has a specific input-efficiency section, and per-ton calculations for water, nitrogen, and pesticides feed scoring in the Soil and Water Management and Pest Management chapters [9].
For Salmon-Safe certification, used in the Pacific Northwest and parts of California, auditors look hard at pesticide use rates relative to production and proximity to waterways. A per-ton record that also captures application dates against rainfall events is the documentation that moves that audit forward fast.
Keep records readable without you standing there to explain them. If an auditor shows up and your notes need decoding, that's a problem. Block codes, consistent units, and a one-page summary per season solve nearly all of it.
How often should you review your input benchmarks?
Annually at minimum. Quarterly if you're actively managing a problem.
Run the annual review after harvest, once tonnage is confirmed. That's when you can calculate final per-ton figures for the season, set them next to prior years, and flag anomalies for next season's spray and fertility planning.
A mid-season review makes sense for water and labor. Irrigation volume per ton is meaningless mid-season since you don't know final yield, but cumulative water use against prior-year pacing flags early whether you're running heavy. Labor hours per task, against prior-year pacing, catches inefficiency early enough to adjust crew size or task order.
For pesticides, a post-bloom review earns its keep in high-pressure disease years. Hit 60% of last year's full-season fungicide cost by early July and you've got unusual disease pressure, a coverage problem driving repeat sprays, or a product switch that moved your cost structure. Catch it mid-season and you can still act.
A three-year rolling average beats any single year for setting benchmarks. One weather anomaly (heavy rain, late frost, smoke damage) distorts a single-year number. Three years smooths it. Five years is better if you've kept the records.
Operations on VitiScribe or similar platforms can run mid-season input-per-projected-ton estimates using prior-year yield as the denominator until actual harvest figures land. It's an approximation. It's also useful for a mid-season decision you have to make now.
What are common mistakes in per-ton tracking and how do you avoid them?
The most common mistake is inconsistent block boundaries. If your spray log uses different block names or groupings than your harvest records or your trellis map, you can't match inputs to tons without reconciling by hand every year. Standardize block codes once, use them everywhere, and don't let custom-hire applicators or harvest contractors scribble their own naming conventions on paperwork you'll need later.
Second, mixing expense categories. Book some fertilizer to materials and some to custom-hire (because someone else broadcast it) and your per-ton fertilizer cost looks artificially low in some years. Pick a category structure and hold it.
Third, forgetting blocks that didn't produce. Frost wipes a block, but the inputs already went in. Those inputs per ton are technically infinite, which breaks your average. Flag those blocks separately instead of folding their costs into producing blocks.
Fourth, inconsistent yield units. Some blocks get weighed in field bins, some in gondolas, some in lug boxes. Convert everything to a common unit (short tons, 2,000 lbs) before you calculate. A block showing 2.1 tons and another showing 4,200 lbs are the same number, but mix them in a spreadsheet without unit flags and you'll get nonsense ratios.
Fifth, tracking only cash costs and ignoring owned equipment. Your own tractor hours cost real money: depreciation, fuel, maintenance. Hire everything out and your per-ton costs look higher than a neighbor who owns iron, even when your actual economics match. UC Davis cost studies carry both cash and non-cash cost structures for exactly this reason [2].
Frequently asked questions
What is a good cost per ton for wine grape production?
It depends heavily on region and variety. UC Davis cost studies show North Coast Cabernet Sauvignon around $1,800 to $3,200 per ton in total production costs, while Central Valley Chardonnay runs $350 to $650 per ton. Organic systems typically add 15 to 30 percent. Your own three-year average beats any regional figure, because your yield history and labor market matter more than the average.
How do I connect my spray records to per-ton benchmarking?
Your spray records already hold what you need: product, rate per acre, and acres treated. Multiply rate by acres to get total product per application event, then sum by block across the season. At harvest, divide by tons from that block. The one link you need is matching spray zones to harvest units. If they aren't the same geographic areas, build a crosswalk table once and reuse it every year.
How long do I need to keep pesticide application records?
EPA's Worker Protection Standard requires two years minimum for pesticide application records. California's pesticide use reporting system has a two-year retention requirement at the grower level too. But if you're certified organic under USDA NOP regulations (7 CFR Part 205), the requirement is five years. Set your retention policy to the longest applicable rule, which for most organic growers is five years.
Can I use per-ton input data for water district compliance reporting?
Yes, and increasingly you'll have to. Many California water districts, under the Sustainable Groundwater Management Act and local Groundwater Sustainability Plans, require agricultural users to report annual use by acreage and, in some plans, by crop type and yield. Gallons per ton is a clean way to show water use efficiency and improvement over time. Keep your irrigation meter readings by block alongside your harvest records.
What's the difference between tracking inputs per acre and per ton for organic certification?
Organic certifiers under USDA NOP care about which inputs you used and whether they're on the approved materials list, not your intensity per ton. But per-ton tracking still helps your program integrity and your sustainability marketing claims. If your organic fruit runs a much higher pesticide material cost per ton than a neighbor's conventional fruit, that's worth understanding, because it may signal a coverage or timing problem rather than simple input substitution.
How do I handle a block that produced nothing due to frost or smoke damage?
Track that block's costs separately and flag it as a zero-yield event. Don't fold those costs into your producing blocks, or you'll inflate their per-ton costs artificially. In your annual summary, note the block, the cause of the loss, and the total cost incurred with no matching yield. This is also exactly the documentation your crop insurance adjuster wants, so the records pull double duty.
Should I track inputs per ton by block or by the whole ranch?
Both. Whole-ranch totals help with your accountant and with year-over-year cost trends. Block-level per-ton figures are where the actionable decisions live: which blocks are expensive to farm relative to their yield and price, which varieties soak up disproportionate spray costs, which areas are candidates for replanting. Ranch-level data without block detail hides exactly the variance benchmarking is meant to surface.
What software or tools are available for tracking vineyard inputs per ton?
At the low end, UC Davis and WSU Extension both publish free enterprise budget spreadsheets with input-tracking structures. For integrated field record-keeping, dedicated vineyard management platforms like VitiScribe combine spray logs, harvest records, and per-ton calculations in one system, so compliance records generate benchmarking data automatically. The right tool depends on your operation's size and the complexity of your block structure.
How does per-ton benchmarking help with winery buyer negotiations?
Most growers negotiate on intuition. A documented cost-per-ton record across three or more years gives you a factual basis for pricing talks. If your production cost per ton rose 18 percent over three years on documented labor and material increases, you have something concrete to show. Buyers negotiate with data too, and a grower who brings organized records commands a different conversation than one who shows up with estimates.
What inputs are typically excluded from per-ton benchmarking calculations?
Land cost (rent or amortized purchase price) is sometimes excluded and sometimes included depending on the framework, so always clarify which you're using. Overhead like office expenses, accounting fees, and health insurance is usually excluded from per-ton field-input benchmarks. Capital investments like new trellising are typically amortized over the asset's useful life rather than expensed in the purchase year, then expressed as an annual per-ton figure.
How do I benchmark my operation against regional averages?
UC Davis publishes annual Cost and Return Studies by crop and region, free to download, with detailed input cost breakdowns. WSU Extension publishes similar enterprise budgets for Washington wine grapes. Cornell Cooperative Extension covers New York varieties. Pull the study for your region and variety, build the same cost categories in your own records, and compare line by line. Differences in a single category (say, disease management) tell you more than total cost comparisons.
Is tracking inputs per ton required by any regulation or certification?
No regulation specifically requires per-ton input intensity calculations. What's required is the underlying data: application records under WPS and state pesticide use reporting laws, input documentation under USDA NOP for organic operations, and water use records under various state water programs. Per-ton tracking is an analytical layer you build on top of required records, and it's what turns compliance paperwork into operational intelligence.
How do I account for shared equipment or shared labor across blocks?
Use time logs or acreage-based allocation. If a sprayer covers three blocks in a day, split the machine cost by acres covered, then assign each block its proportional share. For labor, time-and-motion tracking by block is the most accurate but also the most burdensome. A practical middle ground is to track hours by task across the ranch, then allocate to blocks by acreage. It's an approximation, but a consistent one year over year.
What's the minimum record I need to calculate inputs per ton at season end?
Three things: a complete application log (what, where, when, how much), a complete harvest log (which block, how many tons), and your invoices or account statements to assign costs to each application. With those three, you can build per-ton figures for chemicals, fertilizer, and any purchased input. Labor and equipment hours need a separate time log, but you can start with purchased inputs and add time-based inputs in later seasons.
Sources
- EPA, Worker Protection Standard for Agricultural Pesticides: EPA WPS requires employers to keep pesticide application records for two years, including product, EPA registration number, active ingredient, rate, total amount, method, location, and date
- UC Davis Agricultural Issues Center, Cost and Return Studies for Wine Grapes: UC Davis cost studies for North Coast Cabernet Sauvignon show total cash costs that, when divided by expected yield, produce per-ton figures differing by $600 to $1,200 between low-yield and average-yield scenarios
- California Department of Pesticide Regulation, Pesticide Use Reporting: California requires growers to file pesticide use reports with their county agricultural commissioner within seven days of each application
- California Department of Water Resources, Sustainable Groundwater Management Act: Many California water districts under SGMA require agricultural water users to report annual use by acreage and crop type
- Washington State University Extension, Farm Business Management and Enterprise Budgets: WSU farm business management publishes free enterprise budget spreadsheets with input-tracking structures and recommends linking application logs to harvest records with a summary tab that auto-calculates per-ton figures
- Cornell University College of Agriculture and Life Sciences, Viticulture and Enology: Cornell's viticulture and enology program develops enterprise budget templates for Finger Lakes varieties that include per-ton cost breakdowns
- USDA Agricultural Marketing Service, Harmonized GAP Audit Standard: USDA GAP audits cover traceability and input records, requiring pesticide records with product, rate, date, location, and applicator information
- USDA National Organic Program, 7 CFR Part 205: Under 7 CFR Part 205, certified organic producers must maintain records documenting management and sale of organically produced products for five years; the regulation states 'the producer must maintain records that document the management and sale of organically produced products'
- California Sustainable Winegrowing Alliance, Sustainable Winegrowing Self-Assessment: CSWA's self-assessment tool includes an input efficiency section where per-ton calculations for water, nitrogen, and pesticides are directly relevant to scoring in Soil and Water Management and Pest Management chapters
- UC Cooperative Extension, Cost of Establishment and Production of Wine Grapes, Central Valley: UC Davis cost studies for Central Valley Chardonnay show total production costs of approximately $350 to $650 per ton under conventional farming
- CCOF Certification Services, Organic Certification Requirements: CCOF and other USDA-accredited certifiers require that every input applied appears on the National Organic Program's approved materials list and that records are available for inspection
Last updated 2026-07-11